Is the Fed Done? WW-GMI: +2

“The right way to do it is to pyramid.   I have a buying power of 1,000 shares.   I think Studebaker is going up.   I buy 100 shares.   It doesn’t go up when it should, or worse, goes down.   I sell it out.   The loss can be charged to insurance, or experience, or as necessary cost of getting started right.   Next, I buy 100 Chrysler.   It begins to advance as I anticipated.   So I buy 200 more.   It still does well, so I buy another lot.   And so on.   First thing you know, if it’s good I am long a big line of the right stock with a small initial risk.   I lost only 100 shares in Studebaker; I risked only 100 in Chrysler.   To a degree, the risk in the stock I bought on the way up was mainly the risk of my paper profits; it was not like entirely risking capital as in the initial purchase.”   Gerald Loeb, The Battle for Investment Survival, 1965, p. 81.

Note the perceptive title of Loeb’s book–battle for survival.   All of the great stock traders speak of pyramiding their purchases.   Don’t plunge into a stock and risk a lot of money.   The idea is to make a small pilot buy, test the waters, and then add more shares as the stock moves as you predicted.   I am not talking about day trading.   I am talking about rockets that will rise for maybe a year or so.   This is how to make big money–it is in the big swing, not the minute daily gyrations in price.   I don’t have the time or interest to be glued to the stock monitor every day.   I would rather select stocks that I think will rise for a while, place my stops, and let them rise or be sold out with a small loss.   I will return to this theme later in this post.

For the past week, I have noticed something strange happening in the short term interest rate index. Interestindex505 The steady rising trend seemed to be stalling.   And then the last 2 days it has been in a steep decline.   Could it be that the Fed is startled bythe news   suggesting a slowing economy, and by today’s announcements of downgrades in GM and FORD’s credit status? It was really interesting to see that the market bounced back from a big decline today.   And the charts of FNM and the housing stocks actually held up well today.   A lot of the big caps also seem to be forming bases or are in uptrends–INTC, MSFT, KO, MO,PFE, C, MRK, JPM, AXP,PG, to name a few.   (I am intrigued by IVGN–check it out.)

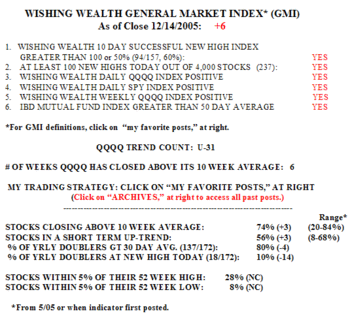
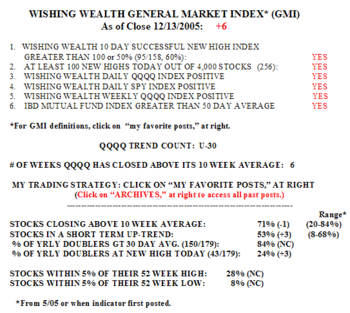
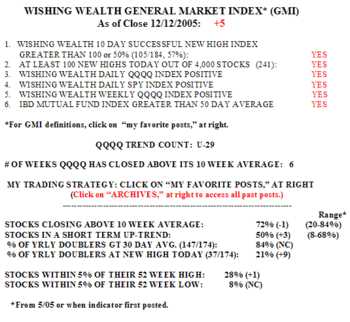
Perhaps most telling was the action of the WW-GMI today.Index505 It moved to +2 with a positive reading from the Daily SPY index.   And the Daily QQQQ Index is very close to turning positive.   I do not receive IBD until tomorrow, so I do not know if their mutual fund index has moved above its 50 day average yet. You may have seen it by the time you read this. There were also 115 new highs today and only 44 new lows in my universe of 4,000 stocks.

So, what should I do with all of these indications?   As much as I was comfortable with the bear case, I have to heed them.   I sold out my put options and made pilot buys in stocks that looked strong.   Remember the discussion of pyramiding above?   I always wade slowly into a stock.   The bottom line is that interest rates may have stabilized, the Fed is on hold, and the market may be turning. I do not predict the market action.   I only try to read what is happening now.   Things could reverse tomorrow again.   However, I have found that at the beginning of an uptrend no one believes in it, and the indexes often go back and forth for a bit.   About 5-10 days after the trend begins it becomes obvious to most people. I guess we will just have to wait and see what develops.—————————————————————-

Some people have sent me questions about trading stocks in their IRA.   I found a somewhat dated site about some of the benefits of doing that.   This link is somewhat more timely now, given that most of us recently completed our tax returns.   Most people do not know they can go short in an IRA by buying put options.   IRA accounts do not allow margin transactions, so we cannot actually short stocks.   I will write about these issues in a future post.   Right now it may be more appropriate to think about ways to go long, rather than short.

A Google Confession–WW-GMI: +1

I have a confession tonight.   The past few days I have been saying that I do not fight a downtrend and stay mainly in cash or short.   Well, I am not perfect. I could not resist nibbling at a stock that was resisting the downtrend.   For several weeks now, Cramer has been recommending GOOG as a great buy.   (I know I criticized Cramer yesterday for not urging viewers to go short or to cash, but he is not perfect either. We can forgive him.)   Cramer maintains that GOOG will earn about $7 per share (total profit/total number of shares) this year.   If the company has a PE ratio (price per share/earnings per share) like Yahoo’s (PE=55), then the stock could reach a price of around $385 (PE: 55=385/7).   Now, I can’t just take Cramer’s word for it.   I have to go to the charts to see if the stock is acting well. Wklygoog_1 You may remember that GOOG came public in a Dutch auction around August, 2004 at around $100.   (Click on weekly chart to enlarge.) The media pundits all said that the stock was too expensive.   That was a buy signal.   The pros probably wanted to accumulate the stock without competing with the little guys.   So the stock hesitated for a few days and then climbed to $216 by February, 2005.   The stock doubled in less than one year!

Remember I wrote a few posts ago about my desire to find rockets as Darvas did–stocks that will go to the moon?   Well, Darvas wrote that one thing he looked for in a stock was a doubling in the past year.   The best predictor of a person’s behavior is his/her past behavior.   The same is true for stocks.   Want to find a stock that will double in the next year–find one that has already doubled in the past year.   Don’t take my word for it.   Look up some of the winners of the past bull market– DELL, CSCO and more recently, CME, BOOM, FORD and HANS.   Rockets keep doubling and hitting new highs and always appear too expensive. You do want to go to the moon, don’t you?   So GOOG passed that test.   It was also trading near an all time high, another characteristic of a rocket.

GOOG declined for a few months and gapped up to a new high in late April (see daily chart) on huge volume, when great earnings were released.Googdly_1 Clearly, people with a lot of money were purchasing this $200 stock.   Was it too late for me to buy?   Was the rise just caused by bears covering their short sales? (buying back the shares they had borrowed from their brokers and sold in anticipation that they could buy back them back at a cheaper price, and pocket the difference in price)   Well, this is what I am trying to share with you tonight– I have found that many stocks begin their advance or decline with a huge gap in price. The trick is to wait to see if the gap is filled.   If the stock keeps on rising to new heights without closing the gap, it is often a sign of tremendous strength. (Note that in January, 2005, a similar gap up was quickly filled—and failed.)   I use TC2005 to scan the entire market for   stocks that have gapped up or down.

So, I bought a few shares of GOOG a few days after the gap, at around 220, and immediately placed a stop order to sell them around $214, if the stock started to close the gap.   In other words, I was willing to take the risk of losing about $7 per share in exchange for the possibility of a profit of $50 or more per share.   I have no idea if GOOG will continue to rise or not.   My point is that I have placed my wager and can now separate myself emotionally from the stock.   I will either profit or lose a little.   (If you are unwilling to have a lot of small losses you should not trade stocks.) I don’t even watch GOOG very much.   Remember, Darvas made his fortune when he was out of the country and far away from the market.   The further one is away from the market, the less the emotion that can kill one’s judgment, and the trade. GOOG closed today at $228.50.

What I want you to understand from this example is the strategy to purchase a potential rocket, and then to place an immediate stop order to control your potential loss if you are wrong.   (Note: A stop order to sell at $214 becomes a market order to sell as soon as the stock trades at or below the stop price.   This does not guarantee the price I will get when I sell the stock.   If GOOG gapped down from above $214 and opened at $210 one day, I would be sold out at the next price, probably around $210.   This would be a relatively rare event, but there is always this risk when using sell stops.)   The next decision I have is when to increase my position if the   stock continues to rise and where to raise my sell stop to.   Livermore and Darvas would make a small pilot buy and then add to the position only if the stock rose, proving them correct in their first purchase.   NEVER BUY MORE OF A STOCK THAT HAS DECLINED–NEVER THROW GOOD $$$ AFTER BAD.   Just take your loss, admit you were wrong and learn from your mistake.

——————————————————–

The WW-GMI moved to +1 today!   Wwmi504 There were 103 new 52 week   highs in the universe of 4,000 stocks that I follow.   However, the IBD Mutual Fund Index remains below its declining 50 day moving average.   The WW-Daily SPY index will turn positive tomorrow if SPY closes above 117 tomorrow.   If this rally proves to have legs, I will begin to close out my put options and go long. The private education stocks were weak again today– APOL (-3.56%) and COCO (-.80%).   I am ready to turn on a dime if this market shows me a definite change in trend.   If it is a real change in trend, I will have plenty of time to gradually take on my line of stocks.   Have a great trading day.

Let’s hope that Charles Kirk’s relative will get better soon and that he will return to writing his excellent blog soon, at www.thekirkreport.com.

CNBC: Forever Bullish

I think you do your listeners a disservice.

Mutual funds must stay invested, individuals do not.   About 70% of stocks go with the market indexes.   When the indexes are declining as they have been for weeks, it is your duty to tell people not to fight the trend.   Get out of the way, safely in cash,   or go short.   Why try to find the few exceptions that can fight the trend.   Go with the odds, as Livermore, Baruch and O’Neil did.

There are enough pundits urging people to buy–you are smarter than that. Or will you lose your audience if you tell people to stay in cash?

Sent to Jim Cramer,   MadMoney show, April 15, 2005

Today, Cramer told his audience to “AVOID” 80% of stocks in this economic environment.   He then went on to describe the stocks they could buy and proceeded to the lightning round of rapid buy/sell/hold advice.   Why does a talented hedge fund manager who clearly sold short and traded options, never advise his listeners to do what he did?   Why is he always looking for buys, when he thinks 80% of stocks are declining?   Does he think the rest of us cannot be trained to use these techniques which he, himself, used, to profit from declines?   Buy in a declining market?   This is insane–now I know why they named the show MadMoney.

One reader sent me a quote from the professor, Peter Navarro, www.peternavarro.com, suggesting why CNBC has a penchant for bullishness:

“Ah, those bullish fumes that so very often make the CNBC bubbleheads such wonderful contrarian indicators.   Oil prices off the charts, interest rates moving inexorably up, inflation pressures building.   No worries.   Be happy at CNBC- cause bearish rhetoric makes for bad ratings- and besides, it’s not their money they are losing for you.”   Navarro’s Broad Outlook for the Market: Smile for the CNBC Camera, 4/4/2005.

Now, I thought I was irreverent!   In researching this quote, I looked over Peter Navarro’s free weekly report and was very impressed.   You might want to check it out at www.peternavarro.com, click on   weekly column. It is nice to see someone else who is not afraid to talk about shorting stocks or to be in cash! Do you think that if Cramer advised listeners to short some stocks, it would destroy his ratings? I think it sure would help his credibility.   This weekend I will begin to discuss how we little people can take advantage of shorting like the big guys–unless the market should undergo a sudden metamorphasis.

Speaking of the market, the WW-GMI for today remains at zero.Index503 There were only 14 stocks   that hit a new high 10 days ago and closed higher today than they closed   10 days ago (when the stock made the new high).   Thus, few of these new highs were successful.   The analogous number for new lows 10 days ago is 43.   In addition, there were more new 52 week lows today than highs (79 vs. 69 in our universe of 4,000 stocks).   However, the SPY is very close to the area where my daily index will turn positive.   If it closes above 117 for 2 days , the index will turn positive and suggest to me that a tradeable rally has begun. The QQQQ is still far away from signaling a turn.

———————————————————————————

I hate to say I told you so, but remember I said Monday night that COCO, CECO and APOL looked sick?   They declined , -4.26%, -9.74% and -1.31%, respectively, today. I guess it was a lucky call.   I sure didn’t know any news about CECO; it was all in the chart. Ceco I identified the downtrend in the weekly chart but have printed the daily chart here to show you the tremendous decline   it had today.   Click on the chart to enlarge it.   Notice how the 50 day moving average (green line)   had topped out in February and that the stock met resistance at this average.   Note the large gap down in February on high volume- a sign of massive institutional selling.   (Gaps in price are worthwhile tracking.) The stock rose back to the 50 day and closed the gap and then began its decline.   The selling was all visible in the chart, and I never knew anything about a class action lawsuit against the company.   Nicolas Darvas would say if he shorted the stock, that he had become a silent partner with the sellers by jumping on board after them.

The housing stocks with the ugly charts   tended to decline today too.   I think this weekend I will post a table tracking the performance of the ugly charts after I   commented on them.   Maybe I should compute a pulchritude index for stocks.   Tomorrow will be a pivotal day for the SPY.   Will it close above 117?