Strong Market, GMI: +6; New Measure of Market Strength; GDW, BBY

To my visitors: I am only one trader, not a guru, and not a financial advisor.  I am presenting my own opinions and my own experiences and people are welcome to decide for themselves what, if anything, on this site is of value to them.  Please refer to the additional comments, highlighted in red, at the end of this post.

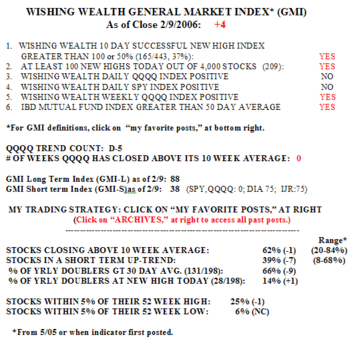
This market keeps getting stronger for those of us who buy stocks at new highs. Gmi617 There were 387 new 52 week highs in my universe of almost 4,000 stocks and only 10 new lows.  Out of the 206 stocks that hit a new high 10 days ago, 152 (74%) closed higher Friday than 10 days earlier.  Two thirds of the  S&P 500 and Dow 30 stocks advanced Friday, compared to 51% of the Nasdaq 100 stocks.  We are in the 30th day of the advance (U-30)…………………………………..

I am introducing today a new measure of the market’s strength.  One indicator of a strong stock is that it trades consistently above its 10 week moving average.  From now on, I will post in the GMI box the percentage of stocks in my universe that have closed that day above their 10 week moving average.  Today, this index registered 80%.  As time goes on I will plot how this indicator relates to the GMI  at market turning points……………………….

Since the QQQQ topped out on June 1, the index has fallen 1.35%.  Here is a list of the best 10 performers in my stock universe since then, that are trading at or near all time highs:  DSTI (+116%), MICU (+68.5%), MXC (+67%), WPTE (+39%), GEOI (+38%), JDO (+32%), GDP (+20%), ENWV (+28%), COSI (+27%), ISRL (+25%). Research their industries and earnings and revenues, and see if any look like future winners………………………..

A friend’s father gave her some shares of stock in GDW in the 1980’s.  She never sold it.  (Click on yearly chart to enlarge.) Oh, that we all had such a stock wise and generous parent. Gdw  This is not the typical rocket stock I trade, but I think it merits attention as a steady performer. You can see by the three blue markers that GDW has split 3 times over the past 20 years.  In that time it has increased 109x from a split adjusted low of  .61 to its Friday close of $66.74.  This is the type of stock I would like to put my sons in (and I still may).  Golden West Financial is the second-largest savings and loan company in the country and it is prospering in this time of refinancing with adjustable rate mortgages.Gdwekly   I do not know how long this 20 year run will continue. But the stock sure came to life again this week!  It closed at 66.74, up 6.29 for the week on high volume and closed just below its all time high of 66.97.  I may place a stop order to buy some for my son’s account around 67 on Monday. Maybe one day in the future he will come back to this post and thank his dad for buying good ol’ GDW for him………………….

Speaking of my sons, my elder son put me on to XM satellite radio when he bought an XM radio for his car.  It is the only stock I ever bought because of its story and not its technical pattern.  I began buying XMSR around 2 and traded it up to 11 and in and out through 30.  It topped out in December, 2004 at 40.89.  Finding potential buys by observing consumers in shopping malls has become known as a Peter Lynch strategy.  I find the strategy can work to give me ideas for stocks to check out.  So, my son came home today from college and went out to buy and install a navigation system in his car.  I think this may be an area ripe for investment.  So, now I need to find what stocks are involved in this field.  The system he bought is made by Pioneer, PIO’s chart looks ugly. Bby  He intends to buy the system at Best Buy—hmmmm.  He says all of his peers 19-25 like Best Buy (not Circuit City).  As this monthly chart shows, BBY broke out of a huge multi-year base this week.  Maybe this is how to capitalize on the trend towards electronic gadgets in the car and home. I looked up the electronics store sector index in TC2005, and low and behold, it is at a new peak, along with such electronic store stocks as ELBO, GME, GTRC, and CONN.  The strength of the sector index and these component stocks suggests to me that this is a sector worth researching for some best buys…………………………………

Send your feedback and questions to: silentknight@wishingwealthblog.com.
Please remember that the stock market is a risky place, especially now.  I am not providing recommendations for you to follow.  My goal is to share tools and methods that I have used over the past 40 years of trading, so that you may learn from them and adapt them to your trading style and needs.  While I do my best, I do not guarantee the accuracy of any statistics computed or any resources linked to my blog.  Please consult with your financial adviser and a mental health practitioner before you enter the stock market,  and please do not take unaffordable risks in the current market environment.  See the About section for more statements designed to protect you (and me) as you navigate this market. Past performance does not guarantee future results, but I would rather learn from a former winner than a loser.

GMI: +6, ETF winners and losers; Interest rates

To my visitors: I am only one trader, not a guru, and not a financial advisor.  I am presenting my own opinions and my own experiences and people are welcome to decide for themselves what, if anything, on this site is of value to them.  Please refer to the additional comments, highlighted in red, at the end of this post.

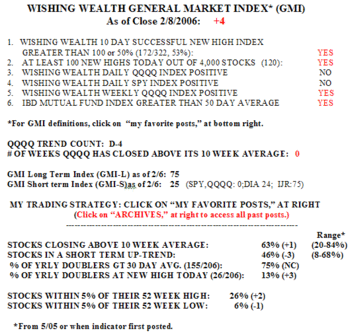
The GMI remains at +6 and the tech stocks continue to lead this rally.Gmi616 There were 291 new highs today in my universe of 4,000 stocks and only 12 new lows.  This is the greatest ratio of new highs to new lows since I posted the GMI on April 26.  By the way, a number of you have asked me how I compute the GMI–just check out my post in the archive on 4/26.  68% of the Nasdaq 100 stocks rose today, 69% of the S&P 500 stocks and 57% of the Dow 30.  This is turning into a respectable rally, having lasted for 29 days (U-29).

I thought you might like to see what ETF’s (exchange traded funds)have performed best in this period.  So, I used TC2005 to run a scan of ETF’s when the QQQQ advanced 5.2%.  The winners are OIH (+10.5%, oil service); EWW (+9.5%, Mexico stocks); IGW (+9%, semiconductors); IYE (+8.8%, energy); PWT and XLE (+8.6%, energy) and IIH (+8.5%, internet).  Clearly the oil and energy sectors were the place to be.  Will they continue to lead this rally? 

The biggest losers include EZA (-5%, South Africa); BHH (-4.5%, B2B internet); EWK (-2.8% Belgium) and EWJ (-1.6%, Japan). Other more traditional sector ETF’s that were weak include PPH, IXP, XLP and XLV. PPH (-1%) includes all of those wonderful pharmaceutical stocks (LLY, BMY, JNJ, WYE, SGP, MRK, VRX—these stocks declined 2.3-13.6% in this period) that the pundits have been recommending  to conservative investors in difficult times (like these??) I told you weeks ago that JNJ looked sick.

By the way, the short term interest rate index I have been monitoringIrx616 cracked today. Speculators are betting less on interest rate hikes, at least today they did. (Click on chart to enlarge.)

Send your feedback and questions to: silentknight@wishingwealthblog.com.
Please remember that the stock market is a risky place, especially now.  I am not providing recommendations for you to follow.  My goal is to share tools and methods that I have used over the past 40 years of trading, so that you may learn from them and adapt them to your trading style and needs.  While I do my best, I do not guarantee the accuracy of any statistics computed or any resources linked to my blog.  Please consult with your financial adviser and a mental health practitioner before you enter the stock market,  and please do not take unaffordable risks in the current market environment.  See the About section for more statements designed to protect you (and me) as you navigate this market. Past performance does not guarantee future results, but I would rather learn from a former winner than a loser.

QQQQ bounced; GMI: +6; Some gappers; Favorite books

To my visitors: I am only one trader, not a guru, and not a financial advisor.  I am presenting my own opinions and my own experiences and people are welcome to decide for themselves what, if anything, on this site is of value to them.  Please refer to the additional comments, highlighted in red, at the end of this post.

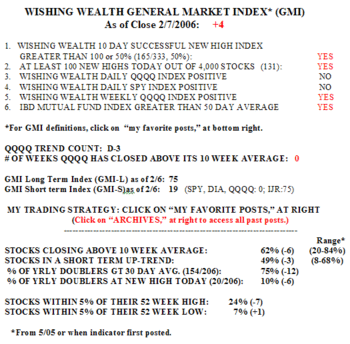
The QQQQ successfully tested its up trend today, bouncing right at support. Gmi615 The coast looks clear to me–I added to my position of QQQQ shares today.  The GMI remains at +6; there were 277 new highs, the largest number in weeks, and only 13 new lows in my universe of 4,000 stocks.  Between 53% and 59% of stocks in the Nasdaq 100, S&P 500, and Dow 30 indexes closed higher today.  Today marks the 28th day in the QQQQ up trend (U-28).  We may be setting up for the end of month/quarter rally I have been anticipating.

Among the stocks that gapped up out of bases on high volume today are:  PGIC, SKX, ARB, FLIR, EBF, PSYS, WCI, and IIIN.  Check them out and, especially, see if news was released that could affect the continuation of the rise.  Good luck!

I added to the side bar (at the right) a list of my favorite stock trading books.  Hope you enjoy them too.

Send your feedback and questions to: silentknight@wishingwealthblog.com.

Please remember that the stock market is a risky place, especially now.  I am not providing recommendations for you to follow.  My goal is to share tools and methods that I have used over the past 40 years of trading, so that you may learn from them and adapt them to your trading style and needs.  While I do my best, I do not guarantee the accuracy of any statistics computed or any resources linked to my blog.  Please consult with your financial adviser and a mental health practitioner before you enter the stock market,  and please do not take unaffordable risks in the current market environment.  See the About section for more statements designed to protect you (and me) as you navigate this market. Past performance does not guarantee future results, but I would rather learn from a former winner than a loser.