GMI: +6; New “doubler” indicator; GMI and QQQQ trends; WPM shows short AND longer term strength; Staying long

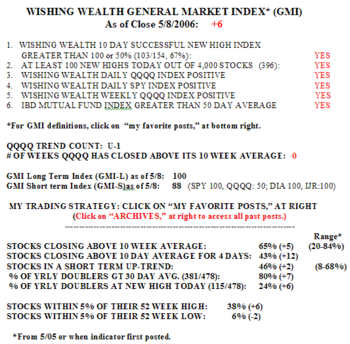
The market closed the week strong with the GMI at a max +6.  This blog has helped me to systematize my trading and stay with the market.  By focusing on the GMI and ignoring everyone’s opinions I have been able to remain with the market’s trend.  One must trade with "what is" and not what I think or hope should be.  As I have written before, if a truck is bearing down on me, it makes no sense to question whether it should be there or heading in my direction.  I must react quickly to what is happening. Gmi909_1 And right now, the GMI is firing on all cylinders.  There were 345 new yearly highs on Friday, and 81% of the S&P 500 stocks and 83% of the Dow 30 stocks advanced. The Nasdaq 100 stocks lagged a little, with 66% advancing.  Almost three quarters (74%) of the 87 stocks that hit new highs 10 days earlier closed higher on Friday than they closed 10 days earlier.  The percentage of stocks in my universe of 4,000 closing above their 10 week averages rose to 63%, highest since 7/29.  And 48% of stocks are in a short term up-trend, the highest number since 7/29.  One third of stocks are within 5% of their yearly highs.  Friday was the fourth day (U-4) in the QQQQ up-trend.

I added a new indicator to the GMI table–% of yearly doublers greater than their 30 day averages.  This indicator tracks the technical strength of all stocks in my universe of 4,000 that have doubled in the past year and traded at least 10,000 shares on that day.    This indicator will tell me when the past year’s leaders are weakening, at least short term.  Weakness in the market leaders often times precedes general market weakness.  The list of doublers will be recalculated at each day’s close by TC2005, according to the criteria I mentioned above.  The total number of doublers in the past year will therefore also provide an indication of the strength of the market. As of Friday, 75% of the 276 doublers closed above their 30 day averages.

As I noted above, the GMI has helped me to stay with the market trend. Gmichanges909_1 This chart (click on to enlarge) shows the changes in the GMI since I started posting it in April.  Note that the GMI remained at +6 from the beginning of the rise on July 8 until August 16, and then declined with the market.  The GMI returned to +6 on September 6 .  You can judge for yourself whether The GMI has been useful for detecting meaningful changes in the market’s trends. Note in the chart that the 10 day average (dotted line) is about to cross above the 30 day average (red line).  This would be another confirmation of a rising trend in the QQQQ.

But the strength is not limited to the QQQQ.  The WPM has strengthened considerably since I last updated it on 8/26. Wpm909 All 5 indexes are now above their 30 day and 30 week averages.  The DIA had given a false signal when it closed below its 30 week average for 2 weeks. Major increases have occurred in the percentage of stocks closing above their 30 day averages, with the range being 56%-65%, up from 17%-26%.  The majority of the stocks in all of these indexes are now in short term up-trends.  The percentage of stocks closing above their 30 week averages also increased, to 50%-73%.  Midcap stocks in the MDY appear to be the strongest group of stocks–short and longer term. (Sometimes I think I should only trade these index ETF’s.)

This strength in the market in the midst of post-Katrina anxiety and general pessimism about the economy is to me a screaming buy signal.  So I have committed most of my resources to the long side of the market.  I have to ignore my emotional tendencies and stay with what the market is doing.  As I begin to trust my indicators more and more, it has become easier to remain consistent with them and to tune out all other influences.  As you know, I am a chicken and will jettison all of my long holdings when my indicators detect market weakness.

Will GOOG burst through $300 this week?

Please send me your feedback at: silentknight@wishingwealthblog.com.

GMI: +6; up-trend intact; Cramer and MO

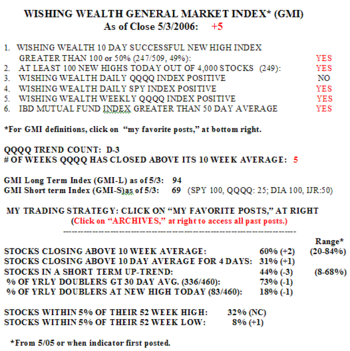
The GMI remains at +6 and things held steady Thursday in spite of declines in the averages. Gmi908  Only 38% of the Nasdaq 100 stocks advanced, along with 26% of the S&P 500 stocks and 17% of the Dow 30 stocks.  However, the percentage of stocks in my universe of 4,000 that are in a short term up-trend increased to 43%.  There were also 214 new highs, and 73% of the stocks that hit a new high 10 days ago closed higher on Thursday than they did 10 days earlier. Thursday is day 3 (U-3) of the QQQQ up-trend. Two former leaders showing strength Thursday are FORD  and XWG (I own this).

Thursday night, Cramer cited a Morgan Stanley report released earlier on Thursday estimating that MO’s break up value far exceeds the price of the stock.  Cramer’s Real Money website had also talked up the stock early Thursday afternoon, so MO had already advanced more than 2% by Thursday’s close when Cramer talked about the stock.  When I take a look at MO’s chart (click on to enlarge) I notice a HUGE volume up day on August 18. Mo  I don’t want to be paranoid, but could it be possible that some people knew that MO was going to be up-graded almost 3 weeks before all of this publicity broke?  Maybe it’s all a coincidence, or a number of big buyers came to similar conclusions regarding MO’s being a great bargain, well in advance of the annnouncement??!!  The only consolation for us, is that we technicians might also have jumped on this train in mid-August when MO rocketed to that new high. Will all these "lucky" early buyers of MO unload their shares Friday to the recipients of all of this media hype?  What do you think?

Please send me your feedback at: silentknight@wishingwealthblog.com.

GMI: +6; Feeling better

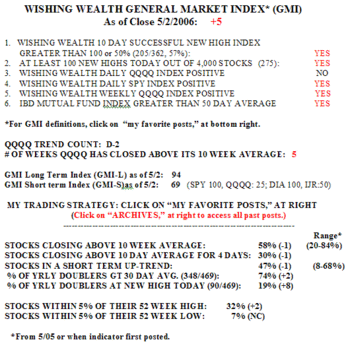
The GMI remains at a strong +6.  I was talking to a retiree I know who is very active in the market.  He buys a large basket of stocks and is usually optimistic.  I was surprised to find that he is very pessimistic about the state of the market and economic conditions.  He is mainly buying preferred stocks and dividend paying stocks.  I told him that I was bullish, not only because the GMI shows the market is rising, but because the news could not get much worse.  With the exception of a terrorist incident in the U.S. or a second hurricane, I just think conditions and sentiment have to improve. I therefore remain true to the GMI and am accumulating stocks. There just are too many technically strong stocks out there.  Have you noticed that GOOG has held up and looks like it may be starting another rise.  Other stocks I own or am looking at include GME, GNSS, LEH, ARE, HANS, WFMI, QQQQ.  I am still short a home builder–this sector looks toppy to me, and SBUX, which has steadily weakened since I flagged it as a sick stock on my post on 8/27.  Gmi907_1

There were 291 new highs Wednesday and 39% of stocks in my universe of 4,000 are in a short term up-trend, the most since 7/29.  64% of stocks that hit a new high 10 days ago closed higher Wednesday than 10 days earlier.  Those of us who buy stocks at new highs are likely to have had some success.  Almost one third (32%) of stocks in my universe are within 5% of their 52 week high and only 4% are near their 52 week low.  62% of stocks closed above their 10 week averages.  How can anyone argue with calling this an up-trending market?!  Between 59%-67% of the stocks in the Nasdaq 100, S&P 500 and the Dow 30 indexes advanced Wednesday.  We are in day 2 (U-2) of the QQQQ up-trend……………………..

I am slowly recovering from the recent catastrophe, but am still a little reticent to talk about making money in these  times of difficulty for many people. I hope you are doing better also. 

Please send me your feedback at: silentknight@wishingwealthblog.com.