The GMI is still at zero. 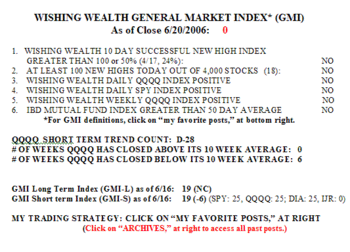 There were 18 new highs and 139 new lows in my universe of nearly 4,000 stocks. 50% of the Nasdaq 100 stocks advanced Tuesday, along with 42% of the S&P 500 and 68% of the Dow 30 stocks. Changes were minimal in any of my other indicators and I am not presenting them. This market is consolidating before it moves again. Tuesday was the 28th day in the current QQQQ down-trend.
All Posts
GMI:0; Few changes
The GMI remains at zero with few changes in my indicators. 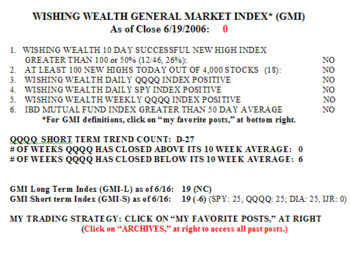 Only 18 new highs and 117 new lows in my universe of 4,000 stocks. Only 18-20% of stocks in the QQQQ, SPY and DIA advanced on Monday. Only 9% of stocks are in a short term up-trend and only 19% of the Nasdaq 100 stocks closed above their 30 day averages. Monday was the 27th day in the QQQQ down-trend……
This is a time for me to remain in cash or in puts as the market remains in a down-trend.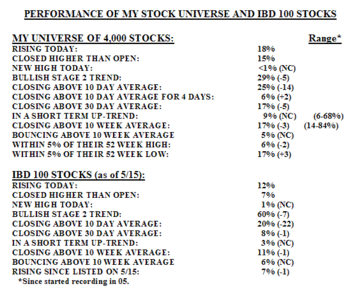
Please send your comments to: silentknight@wishingwealthblog.com.
GMI: 0; Unbiased performance of the IBD 100 stocks; Cash and puts
The GMI starts the new week at zero. 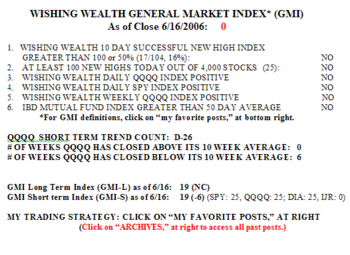 On Friday, 30% of the Nasdaq 100 stocks advanced, along with 28% of the S&P 500 stocks and 50% of the Dow 30 stocks. There were 25 new highs and 52 new lows in my universe of nearly 4,000 stocks. Only 9% of stocks are in a short term up-trend and 20% closed above their 10 week averages. Friday was the 26th day in the current QQQQ down-trend.
There were small changes in the IBD 100 stocks as of 5/15. If you had bought one of these stocks when they were posted on 5/15 and held it through Friday, 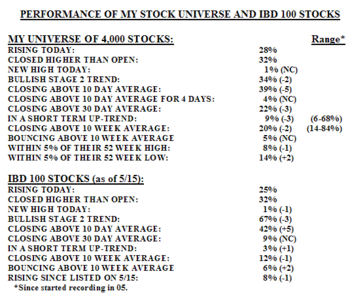 you had an 8/100 chance of having a profit. Only one of the 100 stocks hit a new high on Friday—GYMB……..
In today’s edition, IBD mentions in one place that VOL is being added to the IBD 100 list. And then in another part of the paper, VOL is listed in a table as the top gainer in the IBD 100 stocks. Maybe I am cynical, but I think this is misleading. By deleting the poor performers each week and replacing them with new winners the IBD 100 stock list can always look great. That is why I track in the table above a list of the IBD 100 stocks as of a specified date (currently 5/15) for several months. This approach provides a better estimate of the performance of the IBD 100 stocks over time.
It is too early to tell whether the current rally is just a pause in the down-trend or the beginning of a new up-trend. I remain in cash and in put options.
Please send your comments to: silentknight@wishingwealthblog.com.