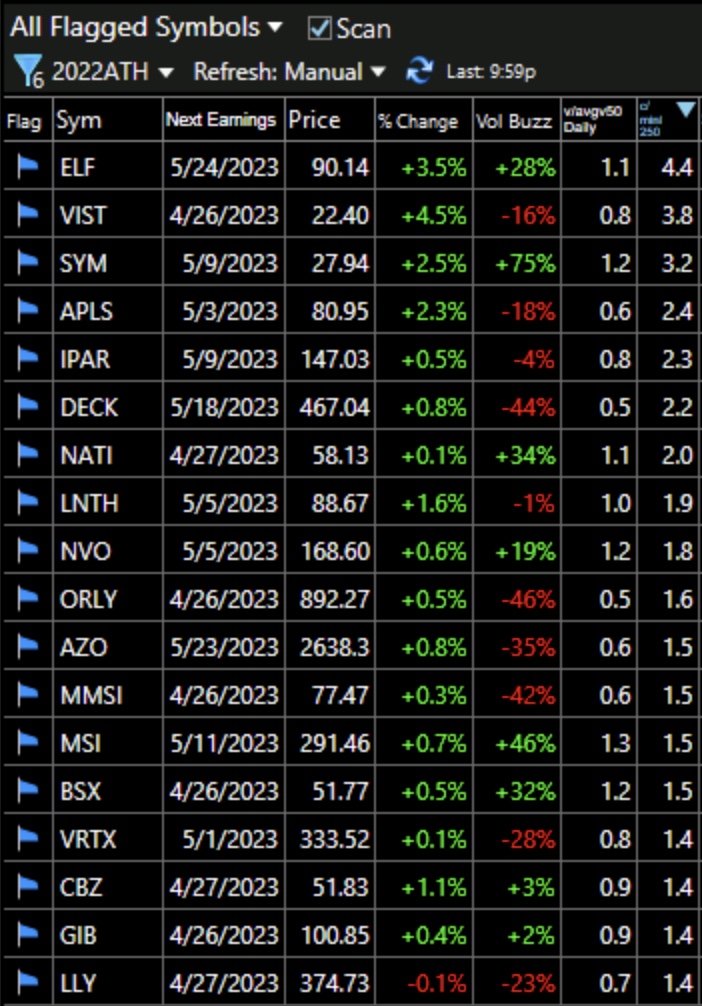
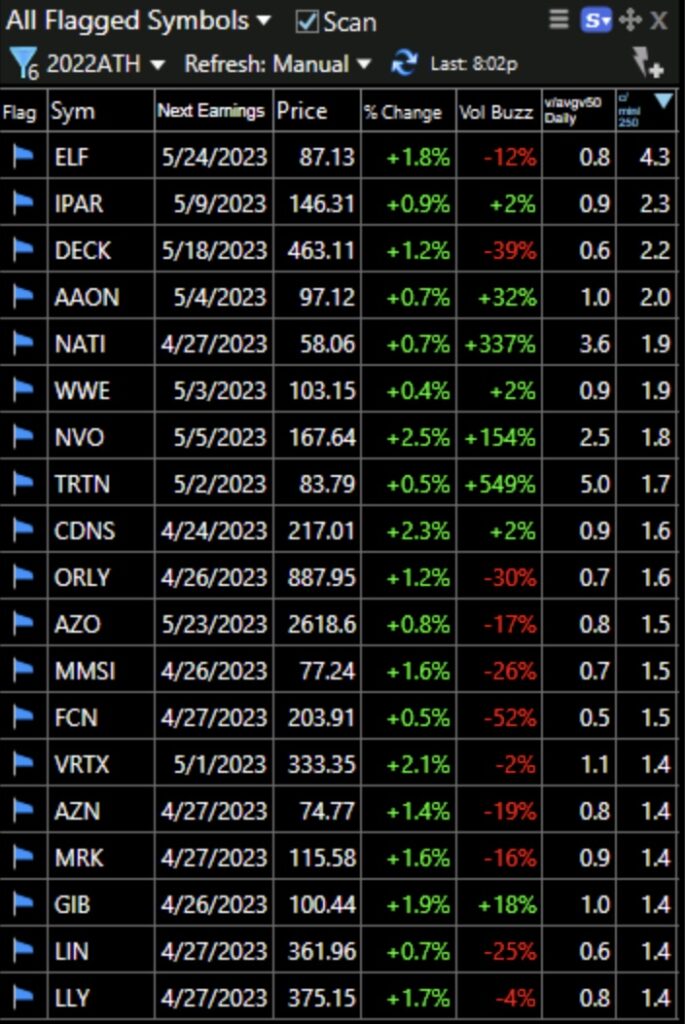
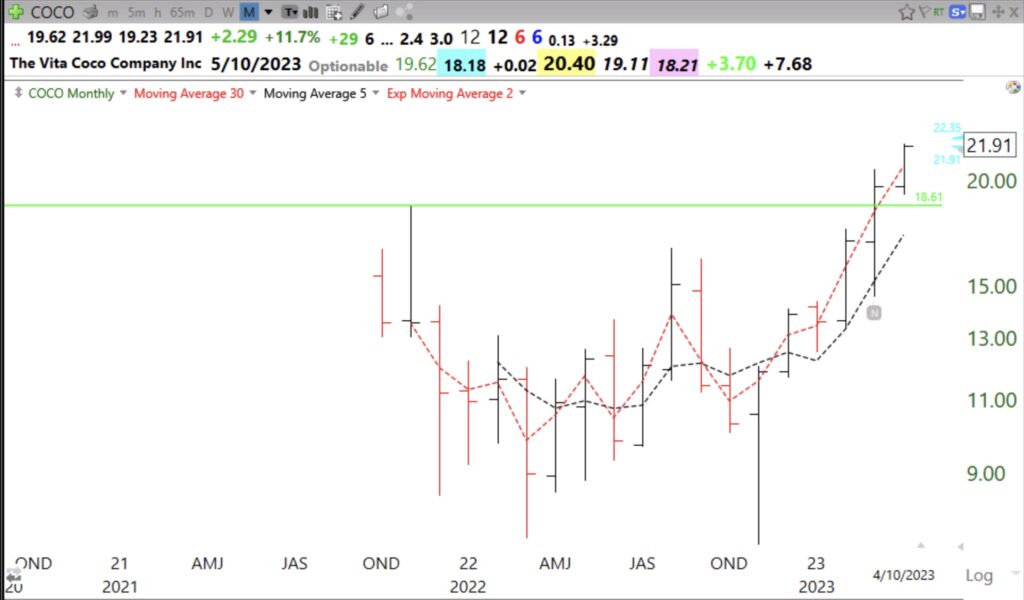
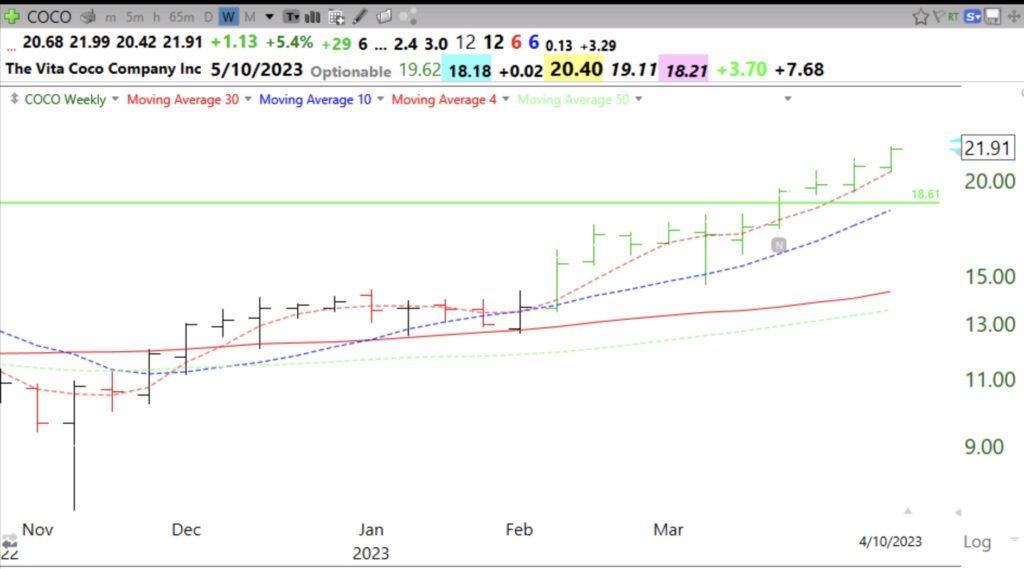
These stocks are sorted according to current price divided by lowest price the past 250 days. Seven are 2x or more their lowest price the past year. Doublers are worth studying to see if they meet one’s set-up for a low risk purchase. Be sure to note the next earnings report date for each, in column 3. The greatest winning stocks break out to an ATH and then go on to a series of ATHs over many months. Why buy the fallen angels when there are some new ones rocketing to historic heights?
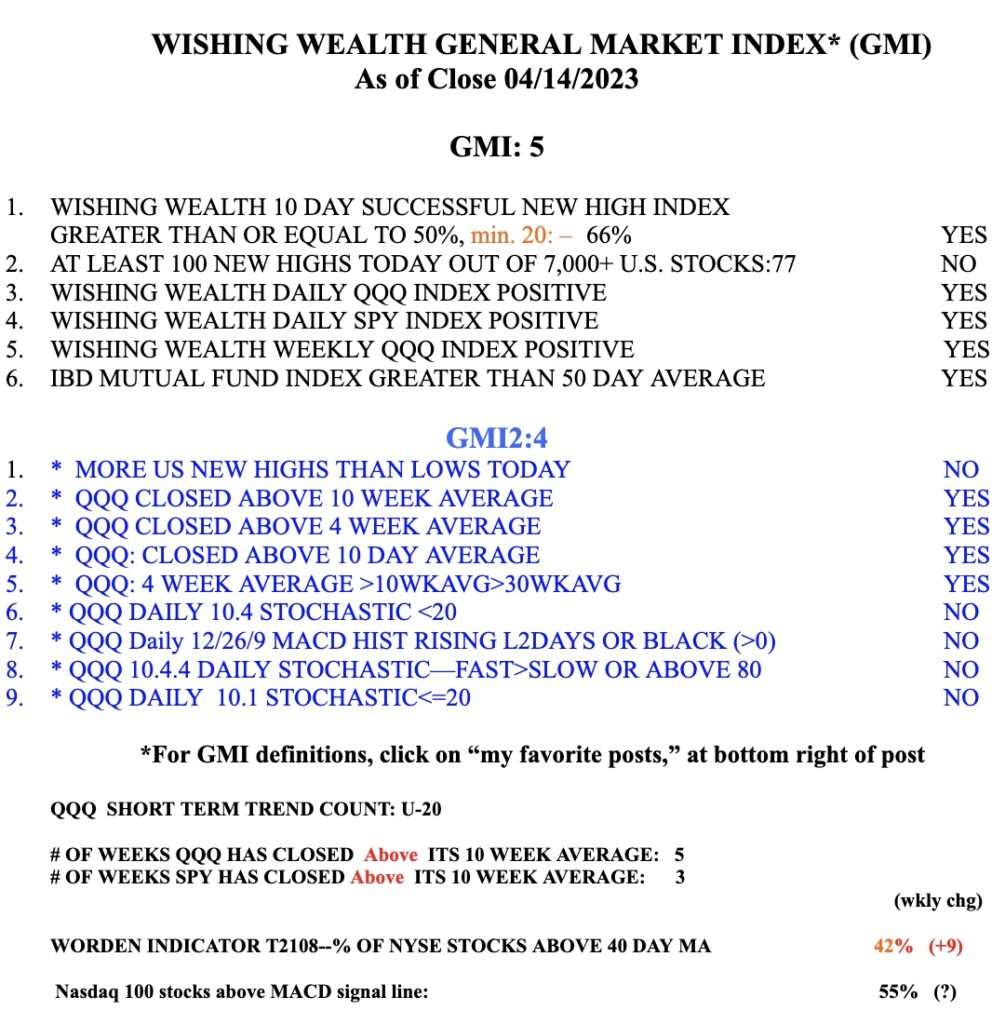
The GMI remains Green. So many people are chasing income instead of growth stocks these days. The crowd is usually wrong and will get back into stocks long after the market has advanced. I noticed for many years that the media proclaimed a bull market about 6 months after the bear market bottom was in.
