The GMI rose to 5 (of 6) and the GMI-R to 90%. There were 189 new highs and 165 new lows in my universe of 4,000 stocks. But my very short term indicators look horrendous with only 13% being positive. A close of the QQQQ below 52 would be a serious break in support. If the bounce in the QQQQ from MSFT’s rise does not keep the QQQQ up on Friday, I will become very defensive. Something about this market really bothers me. Can techs continue to resist the downward momentum in the other stocks? Or will another reduction in interest rates by the Fed next week bring them all back? I still think the best place to be right now is mainly in cash.
All Posts
GMI: 4; GMI-R: 7; mainly in cash
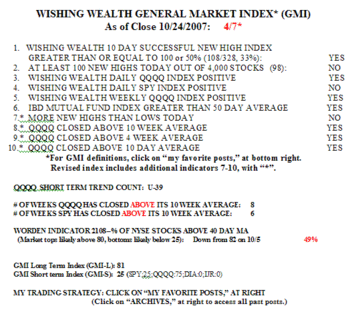
The GMI fell to 4 (of 6) and the GMI-R to 70%. There were 98 new highs and 190 new lows in my universe of 4,000 stocks on Wednesday.  The QQQQ trend remains up in the face of weakness in the DIA, SPY and IJR. Wednesday was the 39th day in the current QQQQ short term up-trend. However, only 48% of the Nasdaq 100 stocks closed above their 30 day averages and only 32% of them rose on Wednesday. With the GMI at 4 and the market so split, I am content to remain mainly in cash for a few more days.
GMI: 5; GMI-R: 9; techs shine
The GMI rose to 5 (of 6) and the GMI-R to 90%. There were 123 new highs in my universe of 4,000 stocks and 81 new lows on Tuesday. While the SPY (and DIA) remain technically weak, the tech stocks, as reflected in the Nasdaq 100 index, remain very strong. The tech leaders, AAPL, RIMM, GOOG, ISRG and AMZN were all big winners on Tuesday. I retained my position in QLD and will begin to write covered calls on IBD100 stocks later this week.
