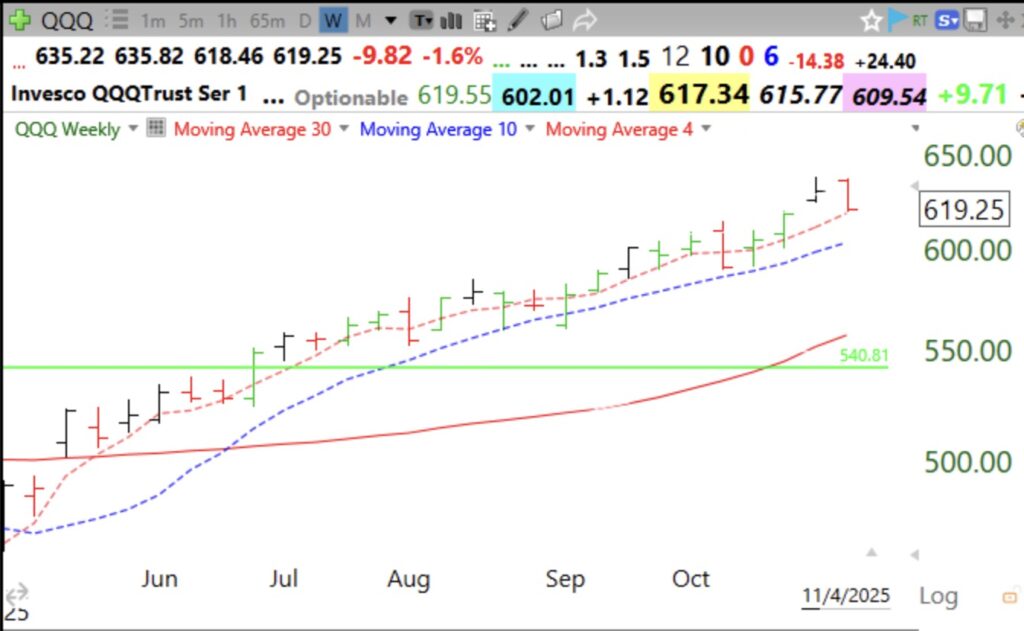
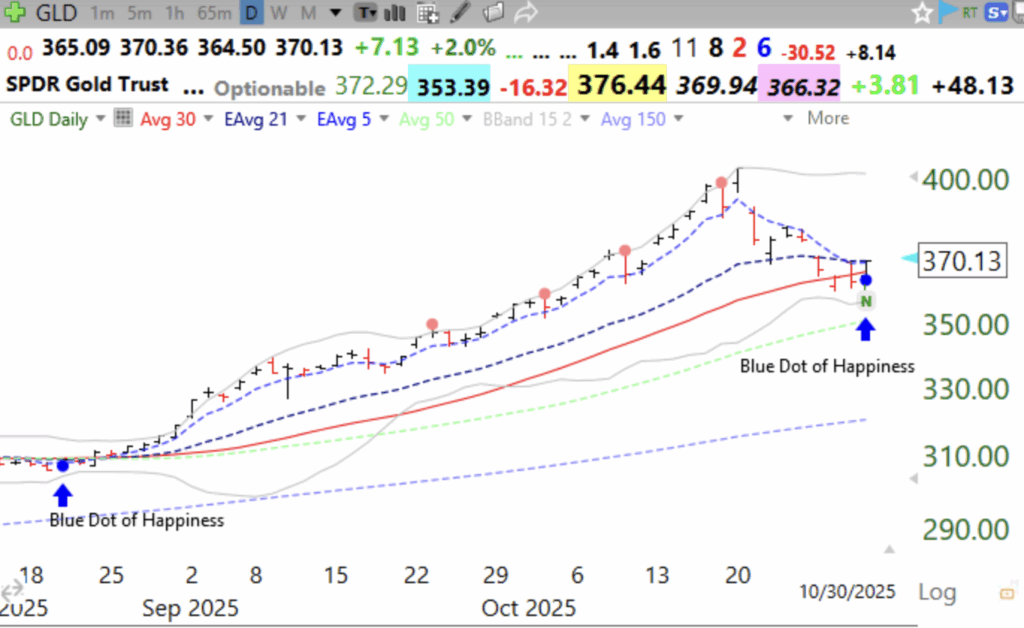
Blog Post: Day 11 of $QQQ short term up-trend; My stock buddy, Judy, taught me that when the weekly price bar is floating above its rising 4 wk average it can be a sign of being extended, see examples in this chart of $GLD

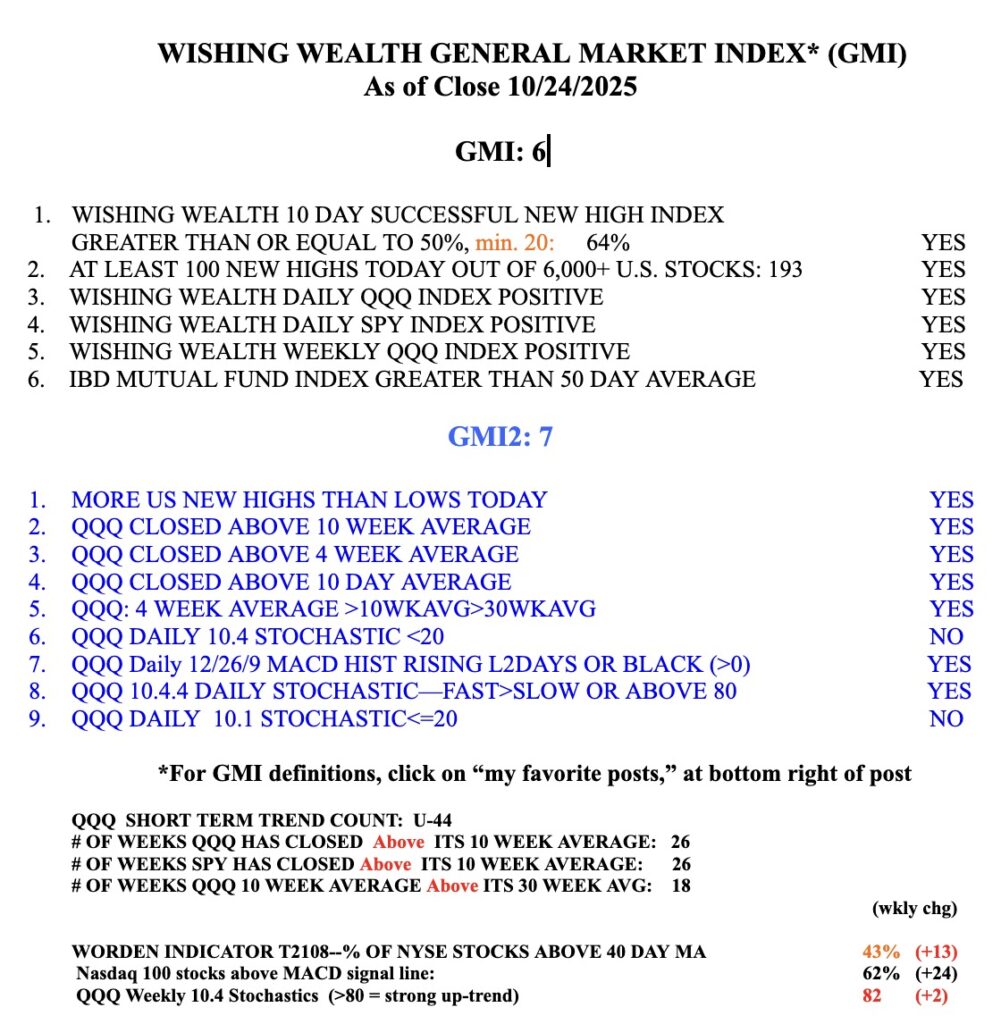
GMI6/6
GMI-27/9
T210863%

Note the floating bars in the circles. Is GLD extended now? Time will tell. I do not initiate purchases when a rising stock shows this pattern. Stocks often return to the 4 wk average and kiss it or form a top after the week of the float.

Screenshot

Blog Post: Day 9 of $QQQ short term up-trend; $NFLX closes at ATH after GLB; see daily and monthly charts; I tweeted this break-out intraday @wishingwealth

GMI6/6
GMI-27/9
T210866%

Follow my tweets during the day and see what I am seeing. NFLX closed above its green line top on volume a little above its 50 day average volume. It closed near its day’s high.

Here is its monthly chart. A stock that can make it all the way back to its 2021 top is showing maximum buying interest. Prior green lines are in orange. To be a successful Green line break-out (GLB) it must not close back below its top green line (@700.99).
Screenshot