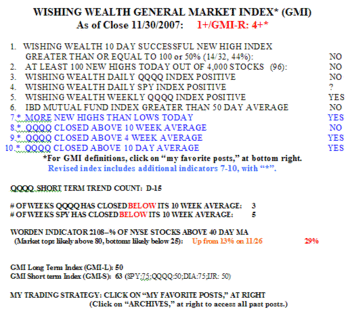
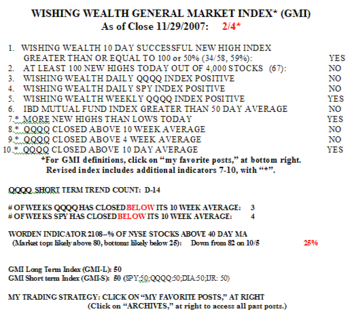
The GMI moved down from 2 to 1+ (of 6) and the GMI-R rose from 4 to 4+ (of 10). Another up day in the SPY will make the Daily SPY Index turn positive.  The GMI-R is stronger than the GMI because it has a number of shorter term indicators that can detect a change in trend earlier. The Worden T2108 Indicator is now at 29%, up from a low of 13% and well out of the area where declines tend to end. Moreover, 63% of the 16 short term indicators for four indexes (DIA, QQQQ, SPY, IJR) that make up the GMI-S are now positive. On Friday the QQQQ completed the 15th day of its short term down-trend (D-15).
So where do I stand on the current market trend? Evidence on the side of a possible end to the current decline in the QQQQ are: 1) MACD for the daily QQQQ has had a bullish cross of its signal line; 2) T2108 indicator is rising out of extreme lows; 3) GMI-R is 4+; GMI-S is now 63%; and 4) leading growth stocks (AAPL, RIMM, ISRG, BIDU) are holding up. On the side of a continuing decline are: 1) GMI is 1+, reflecting a small number of new highs, a weak daily QQQQ trend, a weak IBD growth mutual fund trend; 2) the QQQQ remains below its 10 week average; and 3) the QQQQ has just bounced down off of resistance at the 30 day average. To sum up, it looks like the most sensitive indicators are starting to turn up, but the relatively longer term trend indicators are still declining. Statistically, this is how turnarounds must unfold. The prudent thing to do is to wait a little longer to see whether the longer term indicators follow suit and start to rise. The jury is still out for me…..
If this rally has staying power, I should begin to look at stocks that might lead an up-trend. My TC2007 scan yielded the following rocket stocks that might be among the leaders: MTL, TRA, CF, MOS, HMSY, GEOY, ATRO, MICC, SYNA, ISRG, WGOV. All of these stocks have strong technical patterns plus recent quarterly earnings increases of at least 100% and revenue growth of 20+%. Six of the eleven have appeared on one of the IBD100 lists I have followed during the past year. I will keep an eye on these stocks in case this up-trend continues.
See my disclaimers below.
