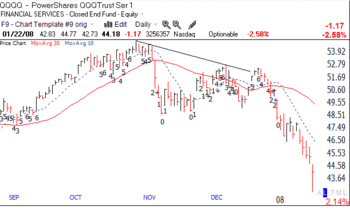
My GMI indicators remain at zero, but there were only 34 new lows and 15 new highs in my universe of 4,000 stocks on Thursday. This was the smallest number of new lows since December 10. Thursday was the 15th day in the current QQQQ short term down-trend. The Worden T2108 is back to 26%, up from a low of 18% on Tuesday. While there is some improvement in my indicators from extremely low levels, it is too soon to determine whether a permanent bottom is in. The trend is still down. My best course is to remain on the sideline, mainly in cash.
All Posts
GMI:0; GMI-R: 0; patiently in cash
After seeing the major indexes the past few days, how can anyone believe that the stock market provides a rational and efficient process for valuing companies? Psychology, not economics, is clearly the largest factor determining stock prices. These large price swings are spawned by fear and greed and it is too risky at this time to put one’s savings into this market . When the GMI (currently 0 out of 6) rises to 3 or more and the trend of the market is clearly up, I will consider re-entering this market. It is relatively easy to make money buying stocks during a nice up-trend. No one forces us into the market. We all (except mutual fund managers) can refuse to play until the conditions we want are present. Until then, I wait patiently in cash and collect interest.
GMI: 0; GMI-R: 0; 1,453 new lows; safely in cash– and patient
The GMI and GMI-R remain at zero. The GMI flashed a sell signal at 2+ on January 2 and has remained at zero since January 4.  (Click on chart to enlarge.) There were 1,453 new lows and 24 new highs in my universe of 4,000 stocks on Tuesday. The percentage of Nasdaq 100 stocks closing above their 30 day averages is now 5%. The Worden T2108 fell one to 18%. Tuesday was the 13th day of the current QQQQ down-trend. Only 13% of the stocks in my universe closed above their 10 week averages. Some of these readings are the lowest I have seen in the past three years.
When I began this blog in 2005 I wrote that I was a chicken and had successfully avoided all significant market declines since 1995. It appears that my indicators have kept me out again. While I do not make recommendations on this blog I did tell you when I went to cash in my pension plan and in my trading IRA. I hope that many of you looked at my indicators and also took actions to protect your funds. The market signaled this decline weeks ago and if we heeded its warnings and ignored most of the "stay invested" media pundits it was possible to emerge unscathed.
The market will signal a bottom at some point and it is critical to concentrate on its behavior. The trick is to wait for the turn and to wade in slowly. Anticipating bottoms is a fruitless exercise. I am very willing to miss quick short-term bounces and to wait for the signs of a real change in trend. When the GMI returns to 3 or 4 and the QQQQ is in an up-trend there will be ample time for me to profit from the rise. In 2003 after the bear market my account gained over 50% in the market rise, without margin (not allowed in an IRA) or the use of options. I have learned over the past 40 years that the secret of success is to be in the market (on the long side) only when the market is in a confirmed up-trend. So I will remain in cash now and monitor the IBD100 stocks for possible future leaders. (See yesterday’s post.) As Jesse Livermore once said, the most money is made in the sitting, not in the trading…..
See my disclaimers at the bottom of yesterday’s post.