We may get a real bounce now. While everyone thinks we have just had a correction, I am concerned that we could get a brief rally that fails and completes a major top. So I remain skeptical until the the market reveals its true trend. If this bounce holds for a while, I would watch NFLX carefully because it has held up very well during the decline. Gold mining stocks and GLD also look like they may be ready to rally. They keep coming up in my bounce from oversold scan.
All Posts
Bounce fails, virtually all stocks decline–short and in cash
The one day bounce begun last Friday could not even hold on Monday. I would be nuts to fight this severe down-trend. The QQQQ short term down-trend completed its 14th day on Monday, having fallen 7% since I identified it. (Trend followers can only identify a trend, sometime after the peak, so the QQQQ is actually down more than 11% from its peak.) Since the first day of the new down-trend (D-1), 97% of the Nasdaq100 stocks, 100% of the Dow 30 and 96% of the S&P500 stocks have declined. This is why determining the general market trend and trading consistent with it is so important. People who have stayed long have had their portfolios decimated. In my IRA trading account, I am in cash and long a little gold via GLD. In addition, I continue to hold a short position in China stocks through the ultra short ETF, FXP, and am short GOOG (via a put option) , which has popped up repeatedly in my submarine scan. Today’s pre-market futures indicate another down opening…………
Submarine scan worked–PWRD dives; Market treacherous
On May 3rd, I posted the results of my submarine scan, designed to detect stocks in a significant down-trend. The scan was run on the close of 4/29 and this table shows the performance of the nine stocks since then. ![]() TC2007 lets me run a watchlist tracking report that shows the changes of each stock in a watchlist as of the date the stock was added to the list. One can see from this list that all 9 stocks have declined, not an unexpected result, given the market’s decline since then. Since the close on 4/29, the QQQQ has declined almost 11% and the S&P500 index (SPY), almost 10%. Note, however, that 5 of the 9 submarine stocks ( 56%) have declined by 15% or more. In comparison, only 17%of the Nasdaq 100 stocks and 19% of the S&P500 component stocks have declined at least 15% during the same period. Thus, my submarine scan detected stocks that were more likely to have taken big dives than would be expected in the components of the Nasdaq100 and S&P500 Indexes.
TC2007 lets me run a watchlist tracking report that shows the changes of each stock in a watchlist as of the date the stock was added to the list. One can see from this list that all 9 stocks have declined, not an unexpected result, given the market’s decline since then. Since the close on 4/29, the QQQQ has declined almost 11% and the S&P500 index (SPY), almost 10%. Note, however, that 5 of the 9 submarine stocks ( 56%) have declined by 15% or more. In comparison, only 17%of the Nasdaq 100 stocks and 19% of the S&P500 component stocks have declined at least 15% during the same period. Thus, my submarine scan detected stocks that were more likely to have taken big dives than would be expected in the components of the Nasdaq100 and S&P500 Indexes.
Furthermore, I wrote in that post on May 2nd, that the charts of 2 Chinese online gaming stocks (NTES and PWRD) looked quite weak and posted a chart of PWRD (click and scroll to post from May 3). Here is the current daily chart of PWRD. 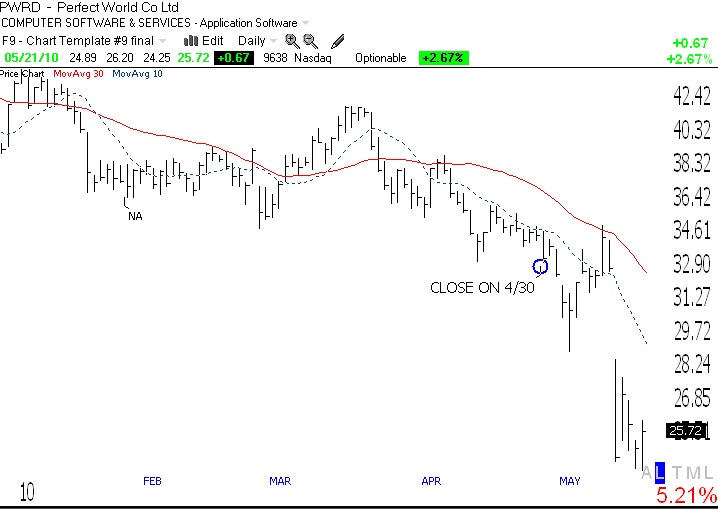 I noted with an arrow the bar on 4/30 which I was looking at when I wrote the post on 5/3. Note the tremendous gap down that occurred in PWRD on 5/17. Both NTES and PWRD are down more than 15% since I wrote about them, but PWRD is down more than 25%. It clearly is possible to scan the market for a set of stocks that are more likely to decline, if the general market weakens……..
As to the general market, all of my indicators are negative. So the GMI and GMI-R are each zero. Friday was the 13th day of the current QQQQ short term down-trend (D-13). The QQQQ and SPY closed below their 10 week averages for three weeks. Only 2 of the Nasdaq 100 stocks closed with their MACD above its signal line, a sign of short term weakness. The Worden T2108 Indicator, at 12%, is still in an oversold area where bottoms or bounces typically occur. 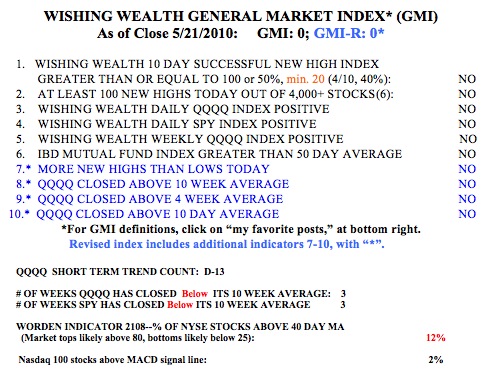 The strength of the bounce that began on Friday will determine whether we are in a brief correction or at the beginning of a major new decline. I am watching the indexes very carefully, and remain mainly in cash in my trading IRA. If it looks like a major decline is likely, I will move to a money market fund in my university pension. This is a very treacherous market and not the time to be a hero. The major markets look very weak to me.