All of my GMI and GMI-R indicators remain positive. I have therefore been riding QLD for a long time. QLD strives to rise (or fall) twice the amount that QQQQ does. I typically accumulate my position in stages once the QQQQ short term up-trend turns positive. When it turns negative, I phase into QID, the inverse QQQQ ultra ETF, which aims to rise twice as much as the QQQQ declines. I accumulate my position in stages so as to reduce my risk if the market suddenly changes its trend. Since the start of the current QQQQ short term up-trend on November 19, the QQQQ has risen +4.6%, while the QLD has risen +9.7%. The more volatile 3X technology bull ETF, TYH, has risen +14.1% during the same period. It is often easier and more profitable to just ride these ultra index ETF’s than to attempt to find an individual stock that will beat them. It all depends on whether one is in the market to look smart or to make money–the two are often mutually exclusive endeavors.
All Posts
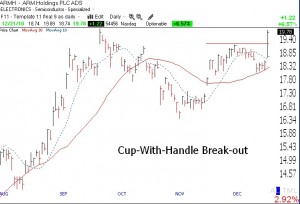
ARMH cup-with-handle break-out
Well, I do not frequently talk about specific stocks that may break out. However, yesterday I wrote that ARMH looked like a possible cup-with-handle base. Go back to Monday’s post and look at the daily chart of ARMH. Then look at Tuesday’s chart below. ARMH lost no time breaking above the handle high (horizontal red line). Given the increased share volume on Monday, this may be the beginning of a nice rise.
21st day of QQQQ short term up-trend; ARMH cup-with-handle?
The up-trend remains intact and the GMI and GMI-R are still at their maximum values.
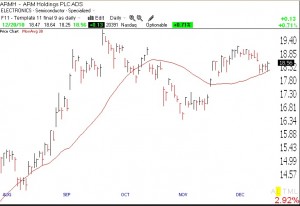
ARMH may be forming a cup-with-handle base. ARMH is an RWB rocket stock. The traditional IBD approach would be to buy it upon a high volume break out a little above the high of the handle, at about 19.06. However, another way I like to to buy is after the stock bounces off its rising 30 day average (red line). After the purchase, I would place my stop order to sell below Monday’s low, at about $18.19. Buying off of the bounce of a proper moving average is a nice strategy because the stop loss can be placed based on the technicals not far from the purchase price, thus producing a small loss if the trade does not work out. (However, the stock may never follow through with the break-out above the handle.) I have found that the most stress free way to trade is to place a proper stop loss order immediately after taking on a position, thereby defining the likely risk. If the stock acts poorly I am likely to be sold out with a small loss and can later buy it back or move on to another stock. Every small loss brings me to the next gain. Click on chart to enlarge.

