All Posts
Blog Post: Day 22 of $QQQ short term up-trend; See list of 14 stocks that at least doubled this year that reached an ATH on Thursday
Last column shows current price divided by price 250 days ago. SMCI leads the pack, at 8x its price a year ago. Study their charts to help you identify wining patterns. Stoc1.1 shows where the stock closed in Thursday’s price bar. For example, BLDR ,with a Stoc1.1= 97, closed near the top of its price bar today (97% of the day’s range). UBER closed near the day’s low.

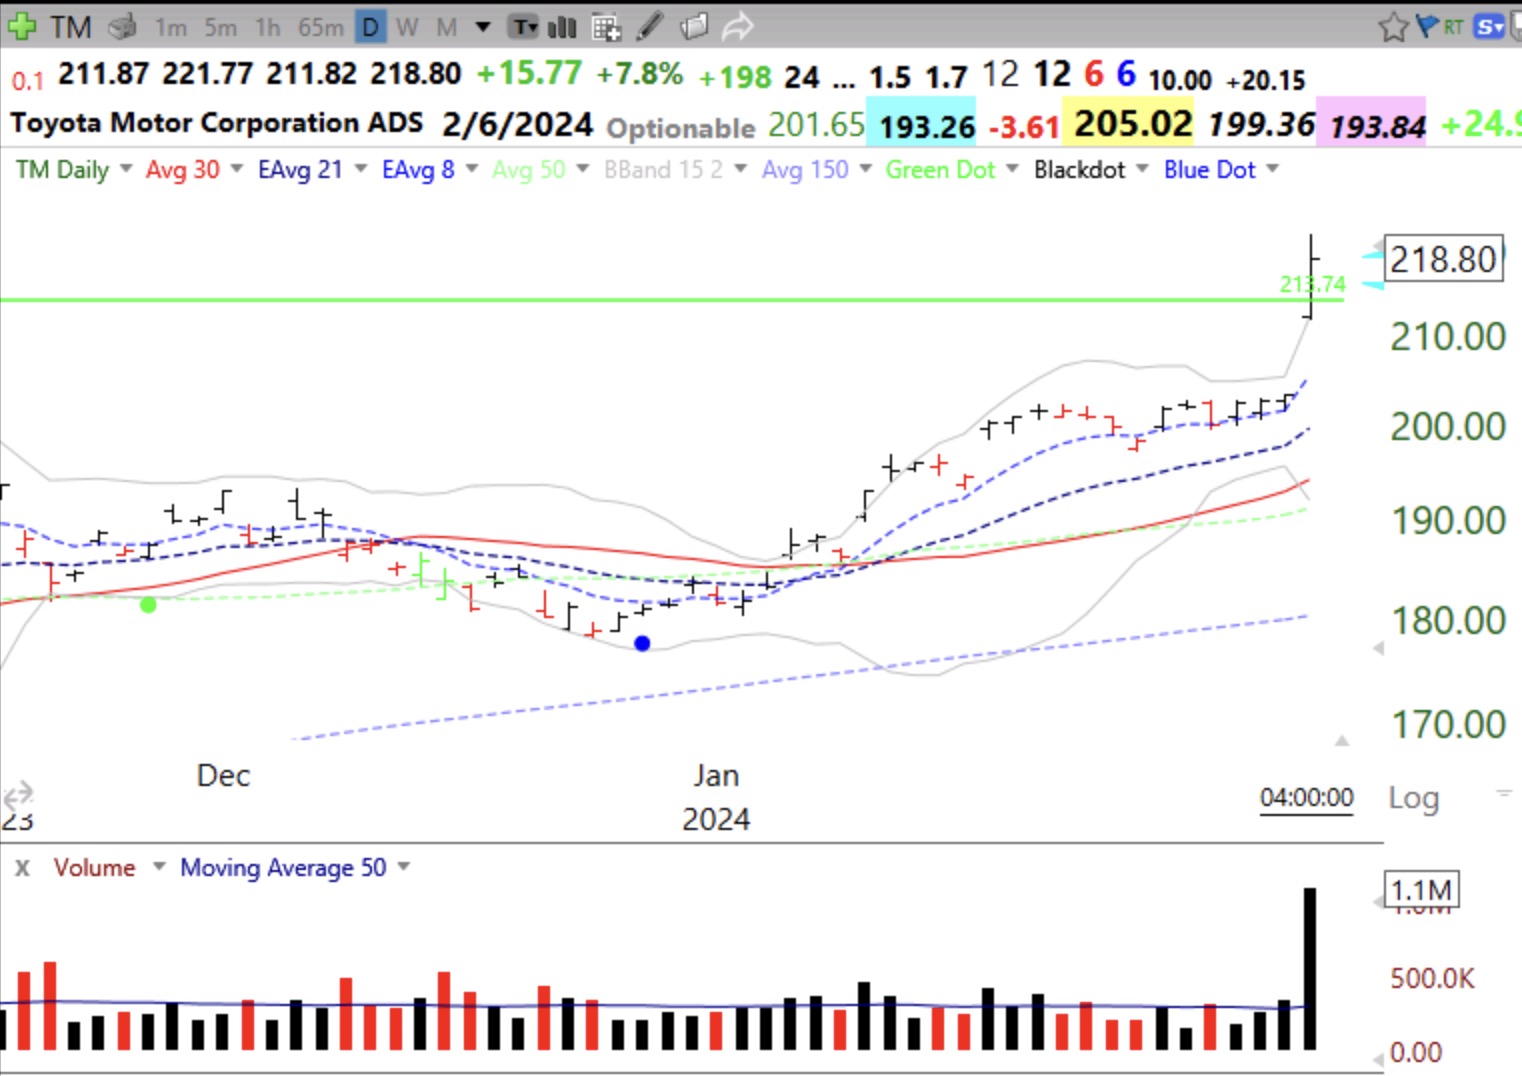
Blog Post: Day 20 of $QQQ short term up-trend; $TM raises outlook and has extreme volume GLB to ATH, see daily chart.
To remain a successful GLB, TM must not close below its green line @213.74 peak reached in January, 2022. Note the huge gap open Tuesday.