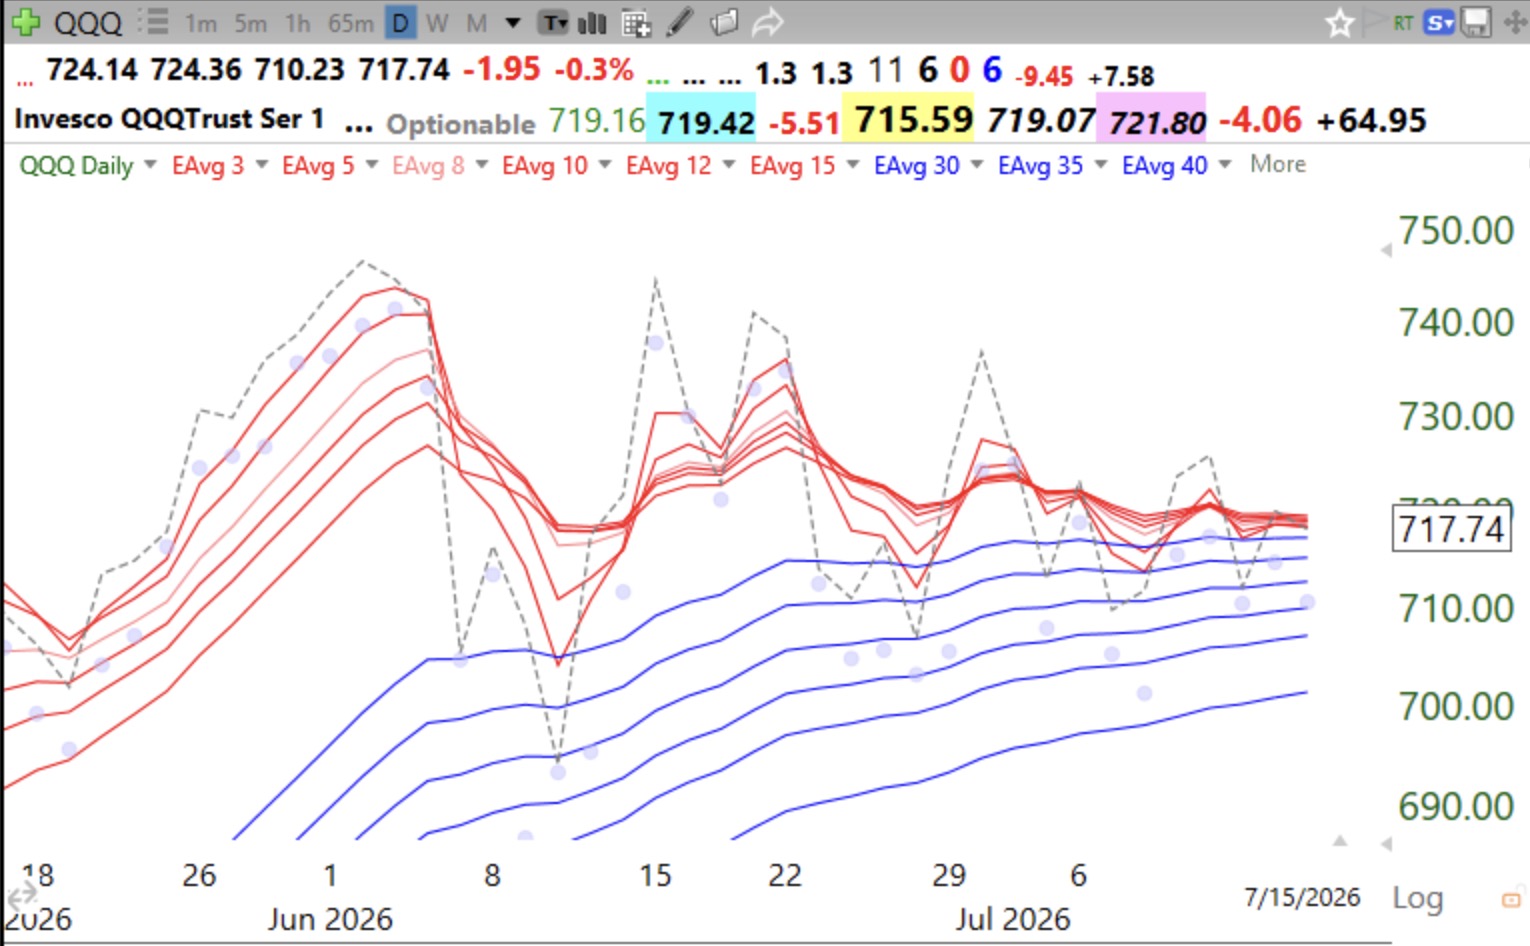
All shorter term averages (red lines) are compressed, showing little change over the past 15 days.
Stock Market Technical Indicators & Analysis
All shorter term averages (red lines) are compressed, showing little change over the past 15 days.
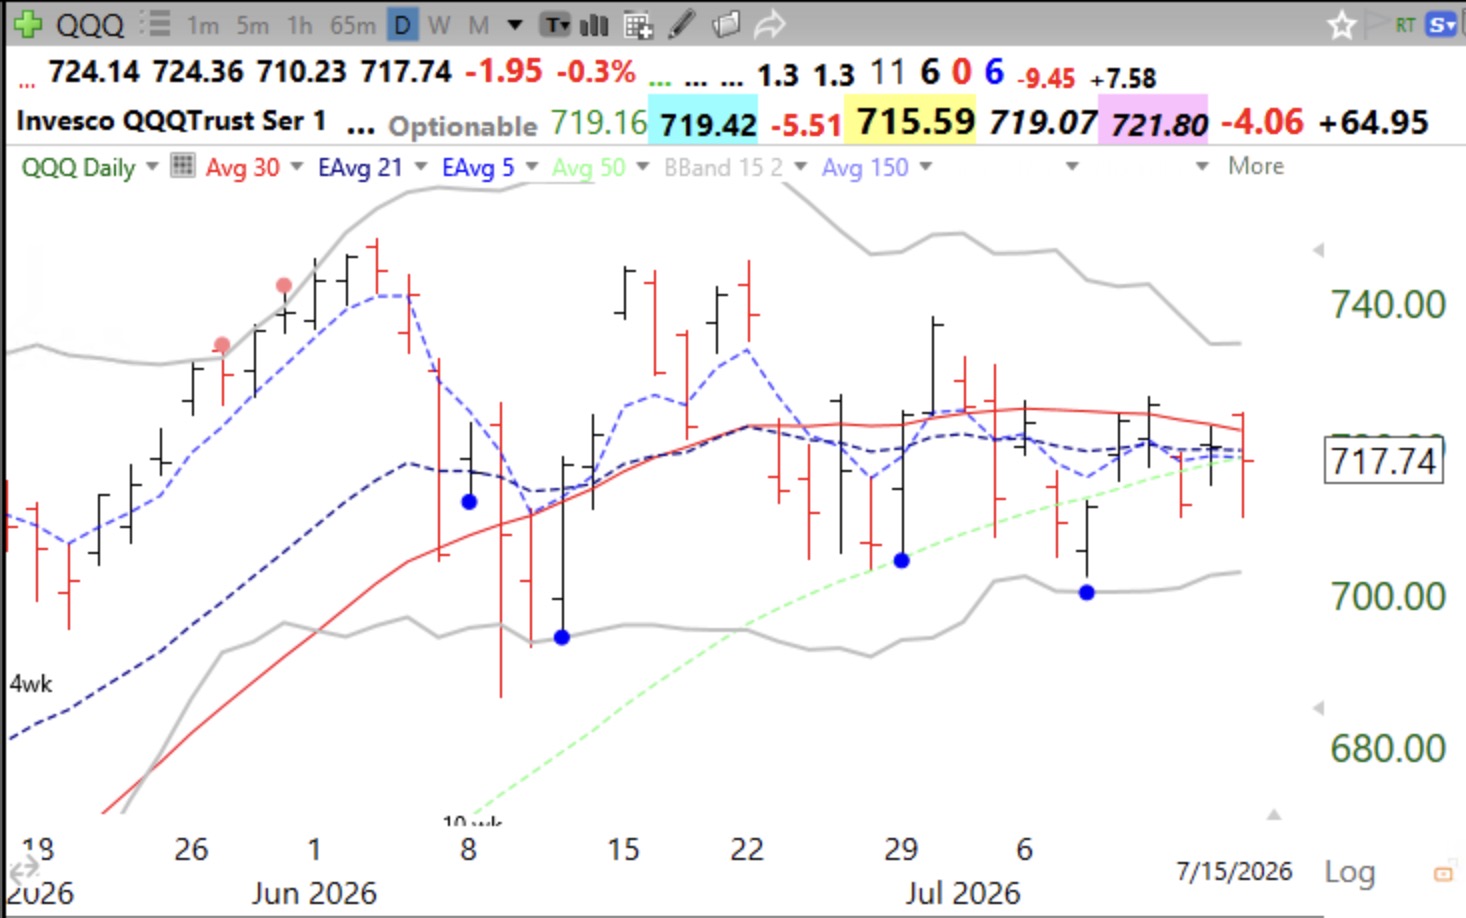
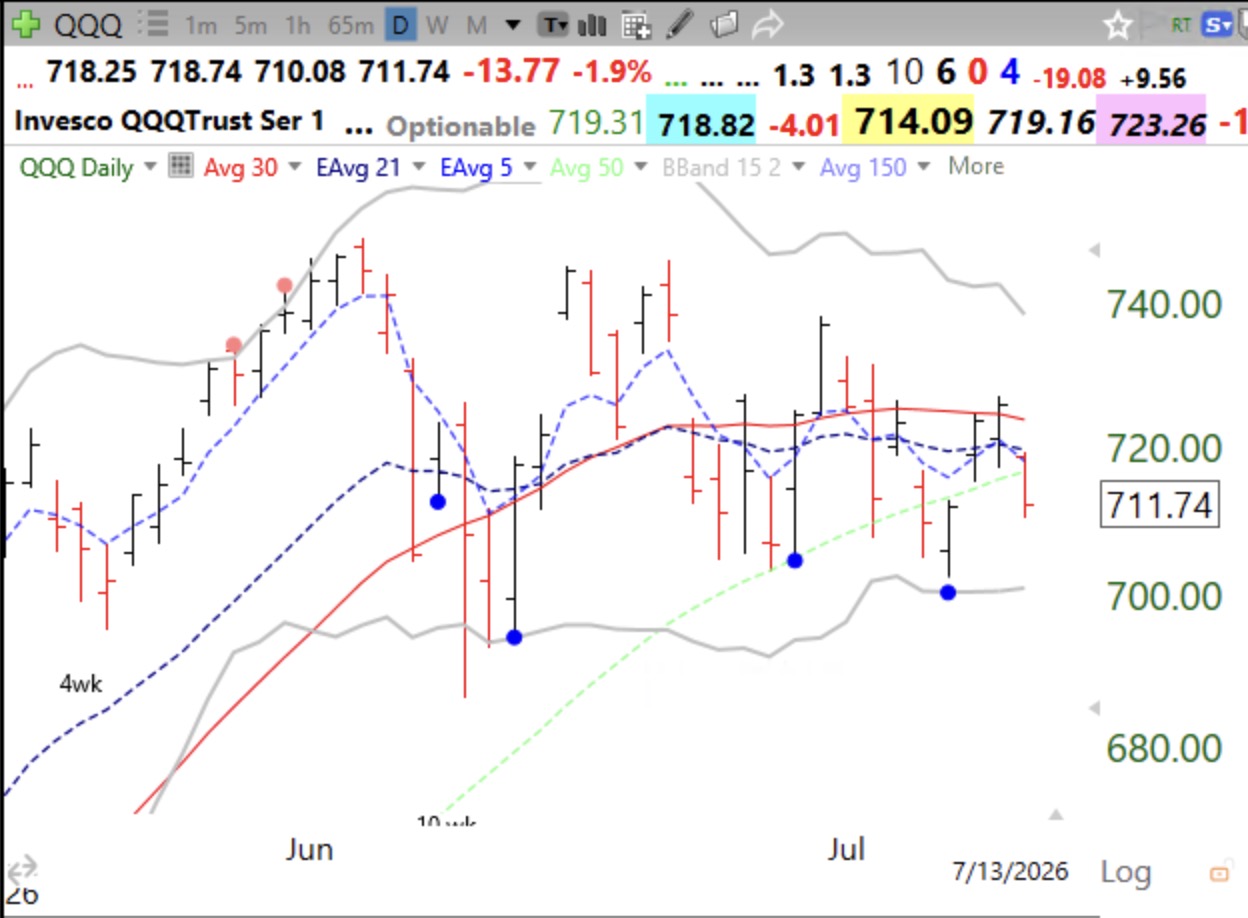
QQQ was down on higher volume Monday than Friday and the 30 day average is curving down, a major sign of weakness. QQQ also closed below its 50 day average (green dotted line). Will QQQ find support at its lower Bollinger band (@700) again? We must react and not predict. Wait for Mr. Market to reveal his intention.
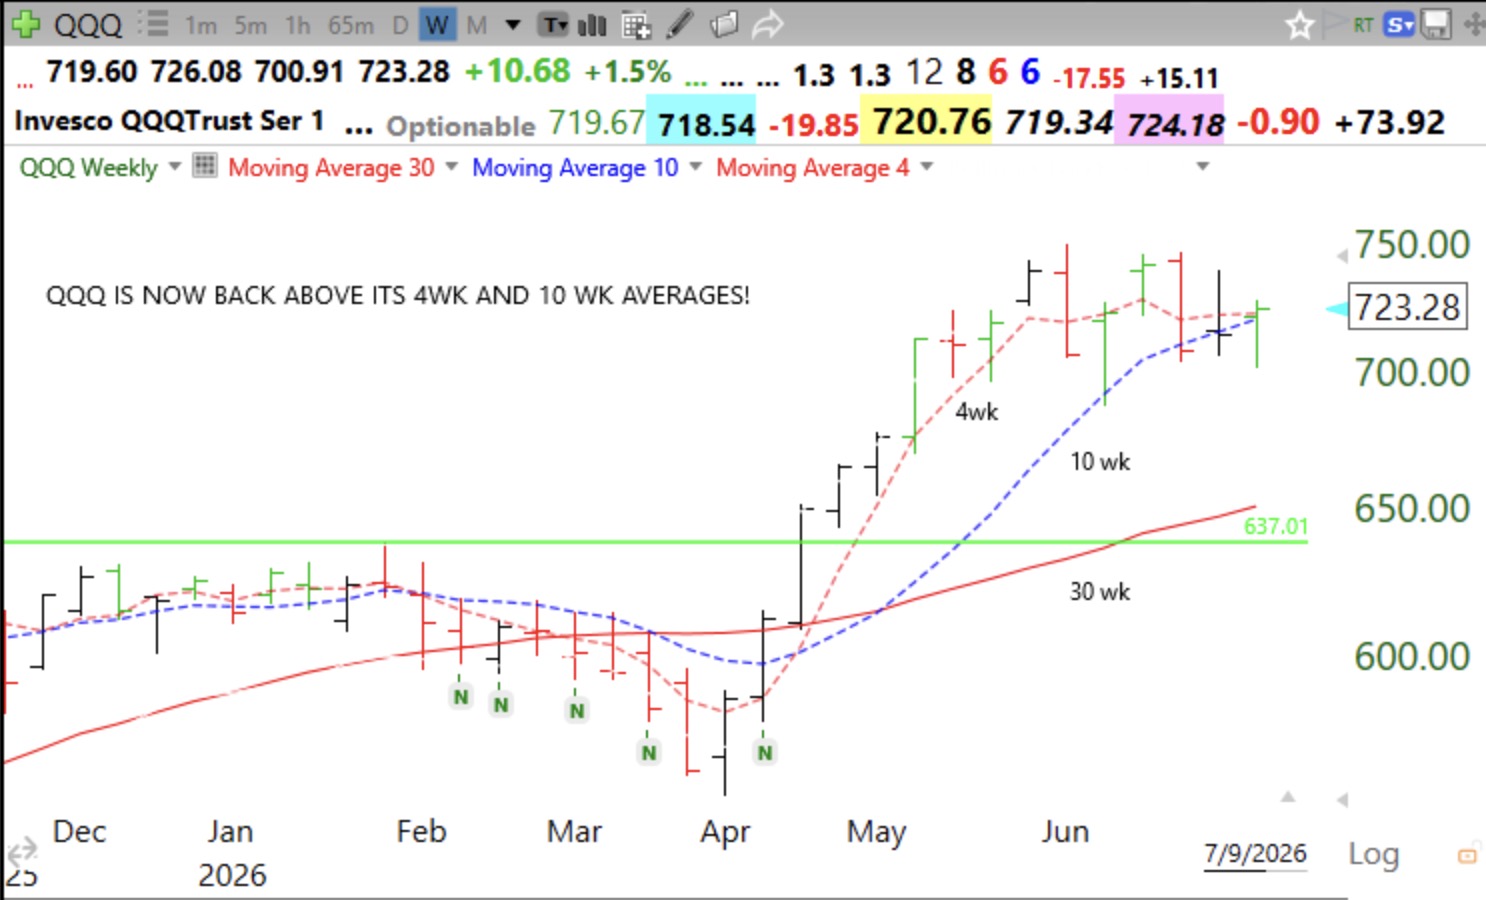
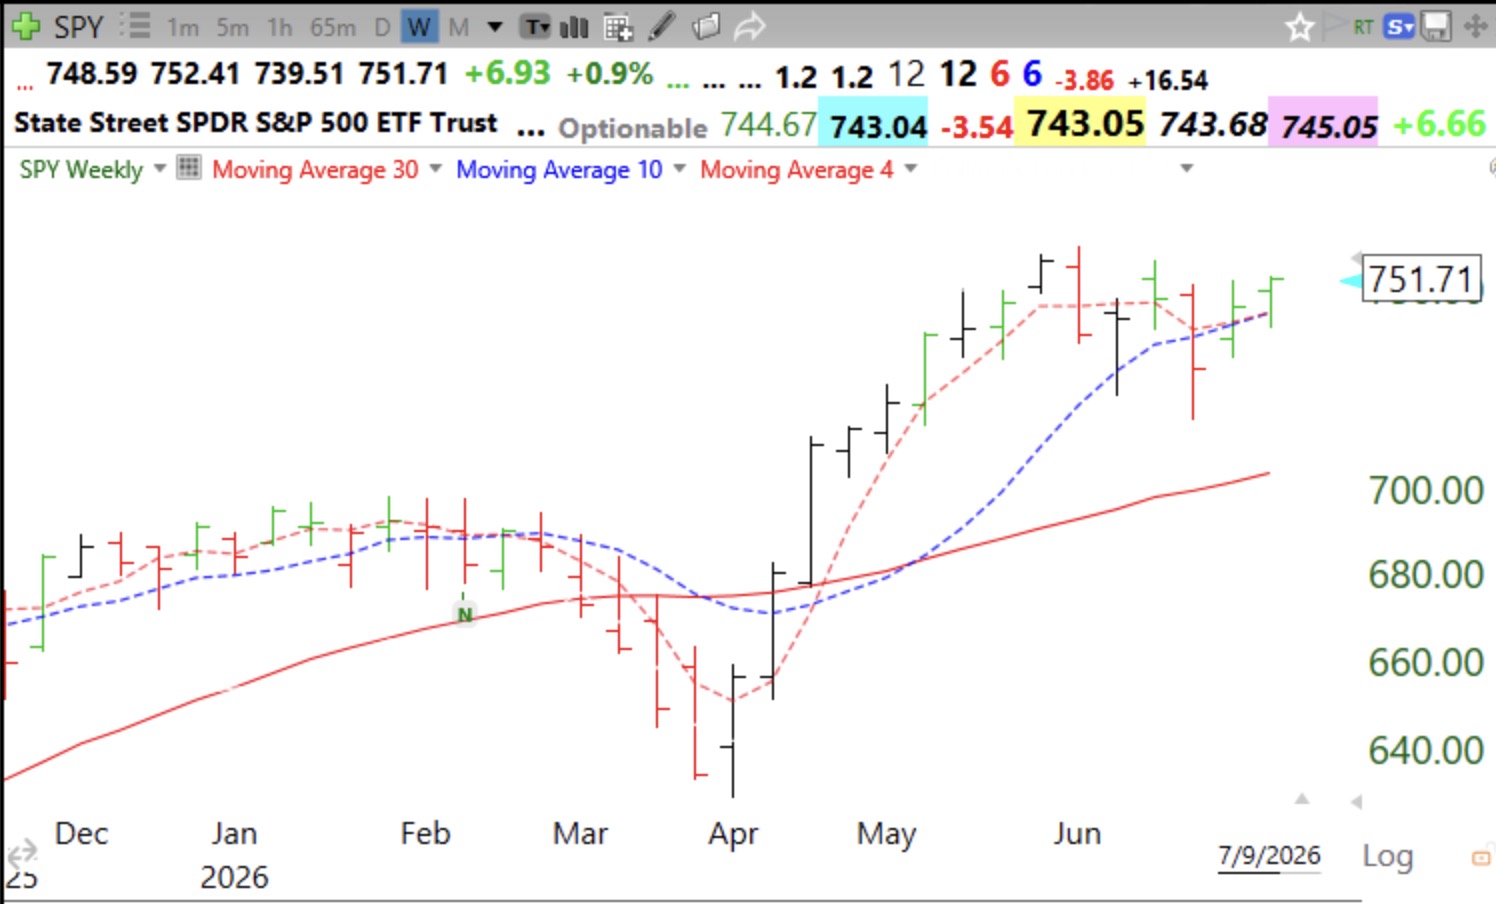
This weekend we shall see if this comeback has held. I focus largely on QQQ which reflects tech and growth stocks. SPY has been somewhat stronger recently, only closing below its 10 week average one week, see its weekly chart.