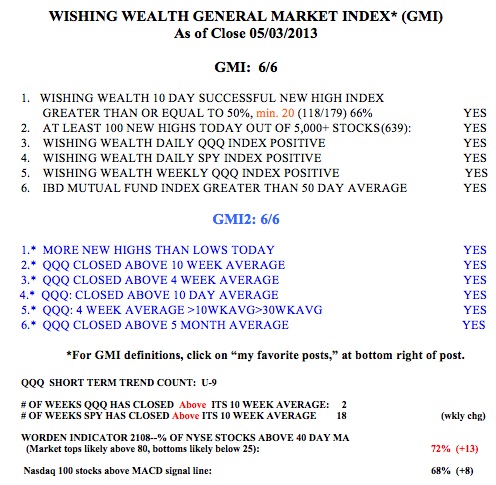
The GMI and GMI-2 are each at 6 (of 6). Stock indexes look a little extended to me. I was away all weekend and could not prepare a more detailed post.
Stock Market Technical Indicators & Analysis
The GMI and GMI-2 are each at 6 (of 6). Stock indexes look a little extended to me. I was away all weekend and could not prepare a more detailed post.
17 stocks came up in my new high and good recent earnings scan:
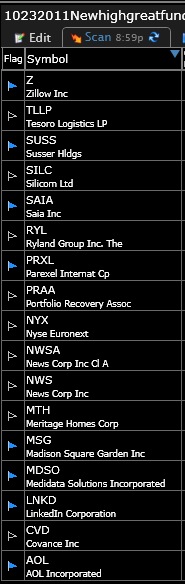
NWS is near a green line break-out of a peak reached in 2000.
Seven stocks came up in my new high and good earnings scan:
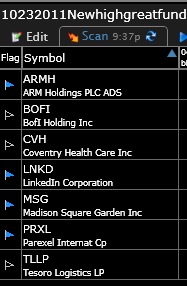
ARMH is close to a green line break-out to an all-time high. It has to close above 50.