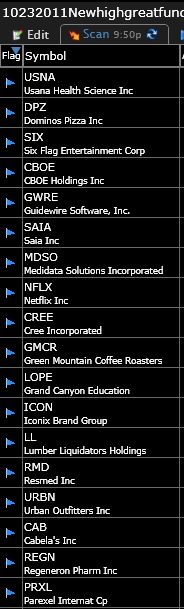
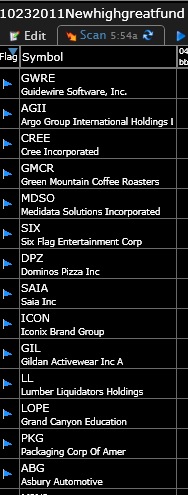
Here are 18 of my new high, good fundamentals scan results:
Stock Market Technical Indicators & Analysis
Here are 18 of my new high, good fundamentals scan results:
Here are the 11 of 28 stocks that came up in my new high and good fundamentals scan from Friday’s close. All of these stocks also appear in one of my lists of stocks mentioned by IBD as possibly strong stocks.
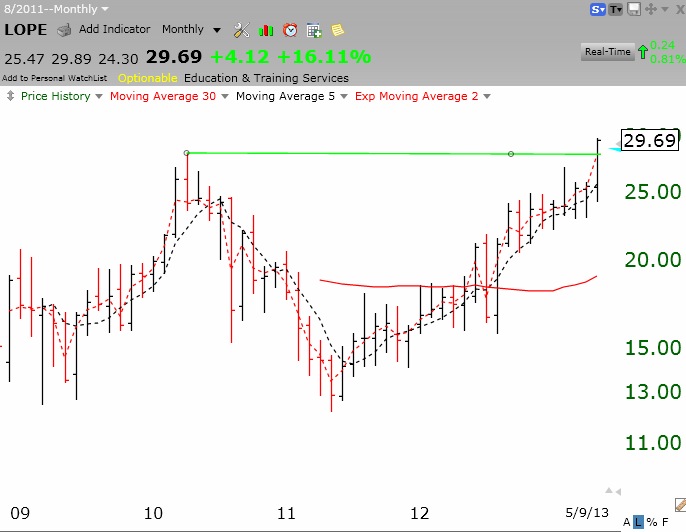
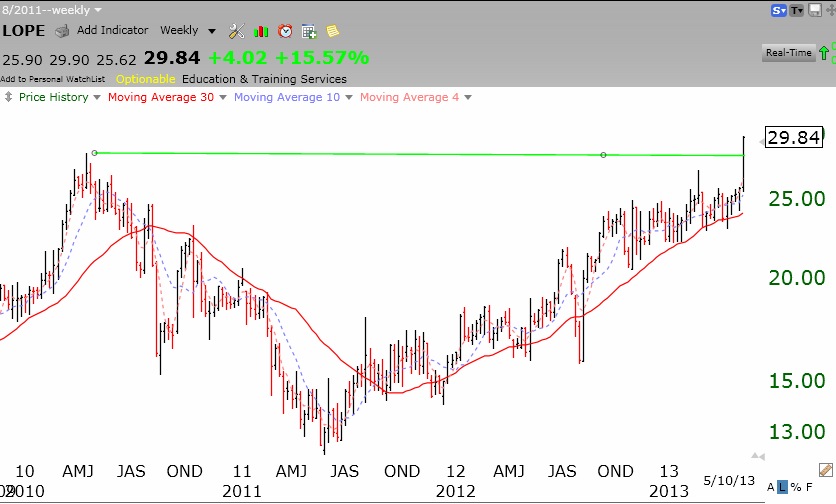
 All of these stocks but 3 (SBRA, CREE and GMCR) are green line stocks, above their highest multi-month base and near all-time highs. LOPE broke out to an all-time high last week on above average volume after it beat earnings estimates.
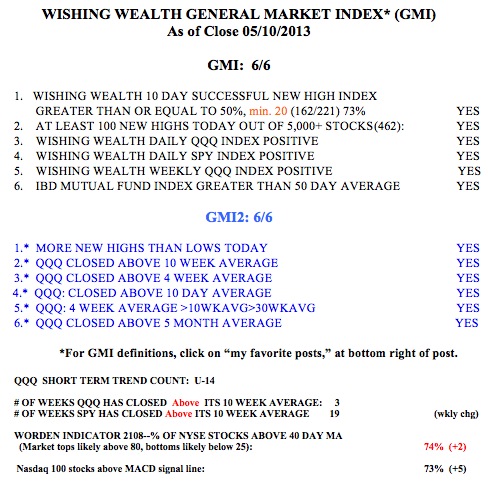
The GMI remains at 6 (of 6) and on a buy signal since 2/28.
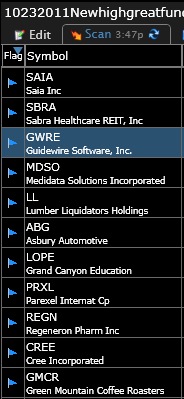
Here are 14 stocks (of 30) that came up in my new high and good fundamentals scan and had a blue flag, indicating that they appeared on one of my lists of IBD noted stocks.
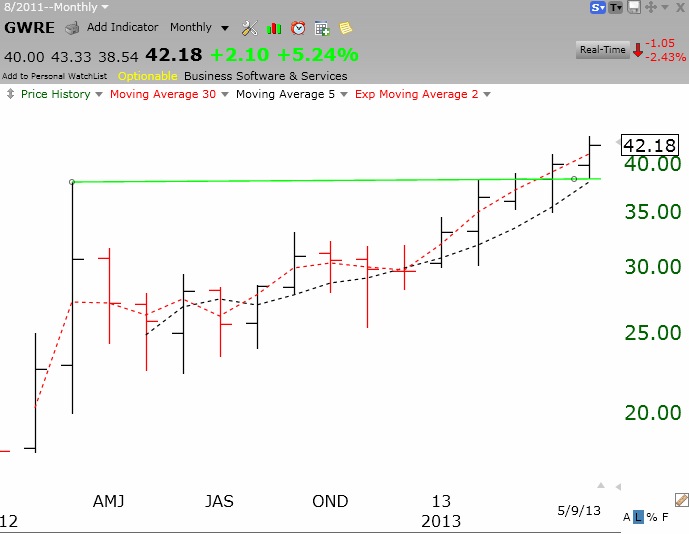
As seen in their monthly charts, LOPE and GWRE are recent green line break-out stocks, to all-time highs.