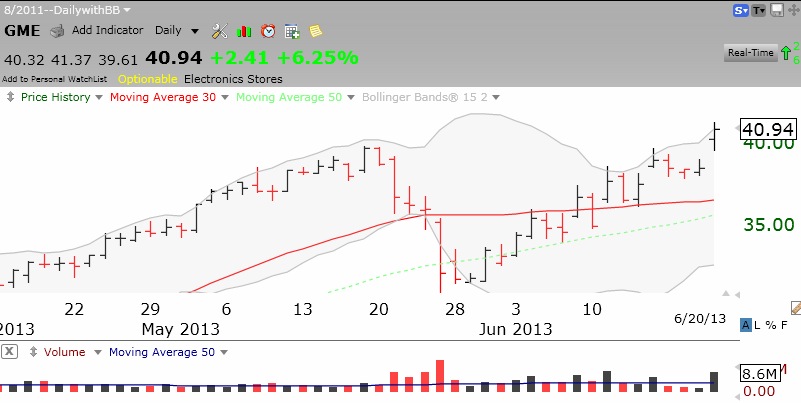
18th day of QQQ short term up-trend; GMI falls to 4, GMI-2 to 0

GMI4/6
GMI-20/9
T210866%

I am in cash in my trading accounts.   Another flat or down day in the QQQ will start a new short term down-trend. There were more new lows than new highs on Thursday. The T2108 is at 66, still in neutral territory.   If we begin a decline, T2108 is a long way from oversold. Here comes Friday the 13th! (I am not superstitious–it’s bad luck.)

QCOR break-out fails; GMI-2 falls to 2; Stage 2 up-trend in doubt, raising cash

GMI6/6
GMI-22/9
T210870%

When a break-out growth stock like QCOR can reverse so quickly (see daily chart below), down 21.8% on Tuesday, it is often a   sign of future market weakness.   I sold my QCOR at a loss on Tuesday. CSTR, CMI, CAT, BIDU, DDD and ISRG also had declines, although   smaller than QCOR’s.

The GMI-2 fell to 2 and IBD now considers the market “up-trend under pressure.”   The 10 week average is now below the 30 week average for   the QQQ, DIA and SPY.   This is a serious sign of potential longer term weakness. In addition, the DIA and SPY both closed below their critical 30 week averages.     QQQ is only .35 of a point above its 30 week average.   If QQQ closes below its 30 week average, I will   exit the market.   I have a cardinal rule only to be in the market if it is in a Weinstein Stage 2 up-trend, defined as closing above its rising 30 week average. I am raising cash in my trading accounts and closing out any position that has not worked out the way I anticipated. If the 30 week average of the QQQ curves down, I will go to cash in my university pension.