 Dr. Wish
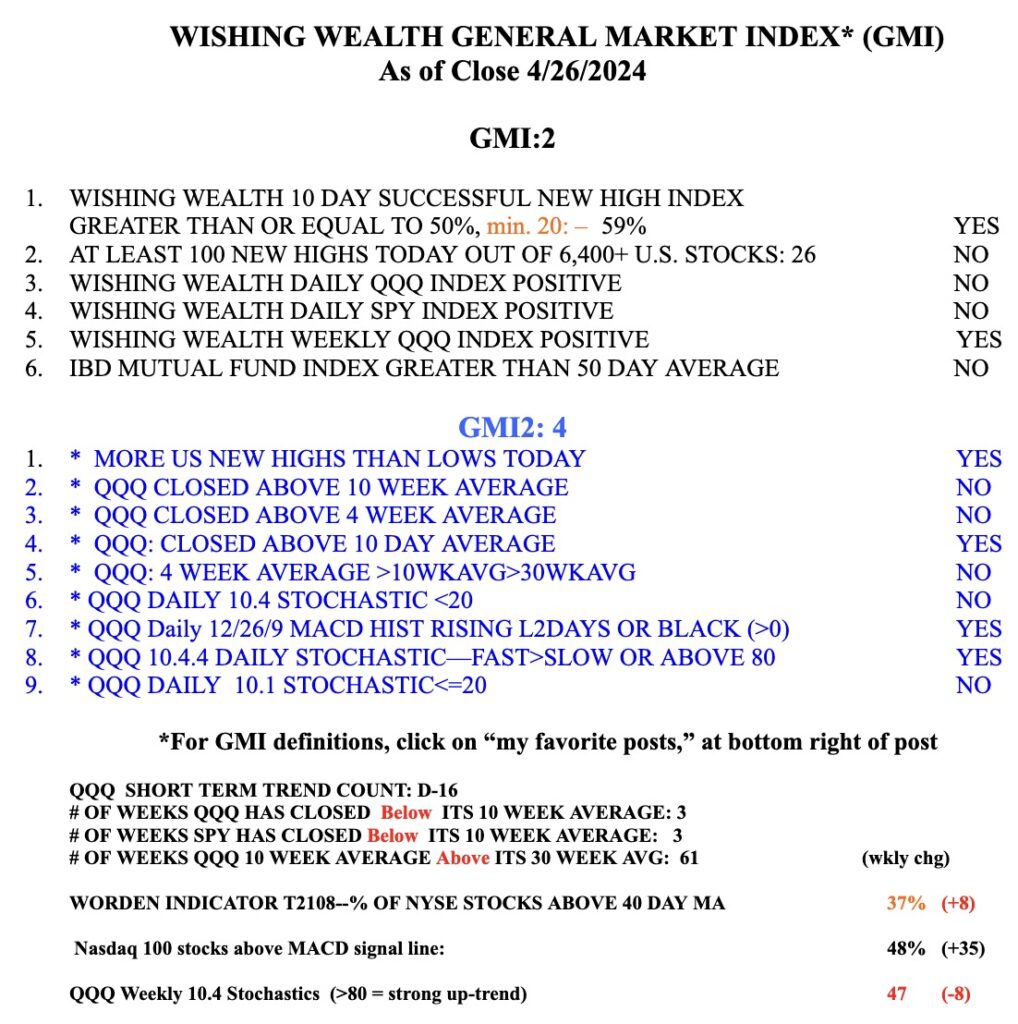
Blog Post: Day 18 of $QQQ short term down-trend; Stocks follow the long bonds; when bonds fall, interest rates are rising and it sucks $$ out of the market; when bonds bottom, rates decline and the market bottoms as investors flee low fixed income for higher yielding securities , see chart
Note the low of the market (SP-500) and 20+ year treasury bonds (TLT) occurred simultaneously last November. Then bonds rose and went sideways as pundits expected the Fed to lower rates. Now bonds are back in a BWR down-trend and the market is weakening. Cash is king! The next advance will be under way when the shorter averages (red lines) for TLT rise above the longer term averages (blue lines) and form a RWB pattern. Stay tuned….


