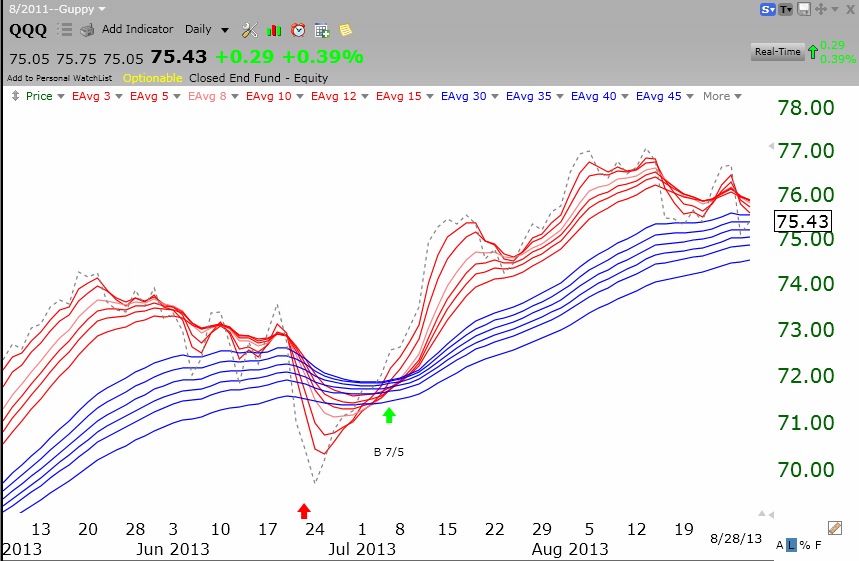
The QQQ short term up-trend has ended. I usually have confidence in a change in the short tern trend when it reaches the 5th day. So, I bought a little SQQQ and will add more if the down-trend persists. The Worden T2108 is at 26%, getting close to over-sold territory, however. This daily Guppy chart of the QQQ shows that all of the shorter averages (red lines) have turned down and are now converging with the longer averages (blue lines). In a strong up-trend there is a white band between the two, yielding a red white and blue pattern. Time will tell how steep this decline will be. One more day with the GMI below 3 will cause a more significant Sell signal.