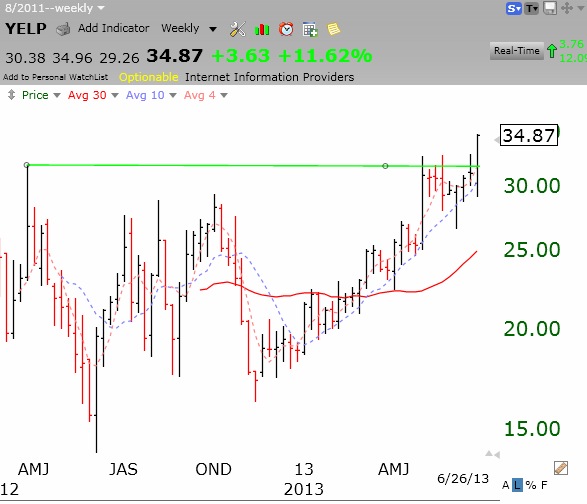
Waiting for next week to see if this bounce holds. I noticed that YELP broke out to an all-time high on Wednesday. Check out its weekly chart.
Stock Market Technical Indicators & Analysis
Waiting for next week to see if this bounce holds. I noticed that YELP broke out to an all-time high on Wednesday. Check out its weekly chart.
With the GMI on a Sell signal, I am mainly in cash in my trading accounts. No one knows if this is a dead cat bounce or a real bottom. But this is the end-of-quarter mutual fund window dressing period. The key is what the market does next week. Then comes second quarter earnings….
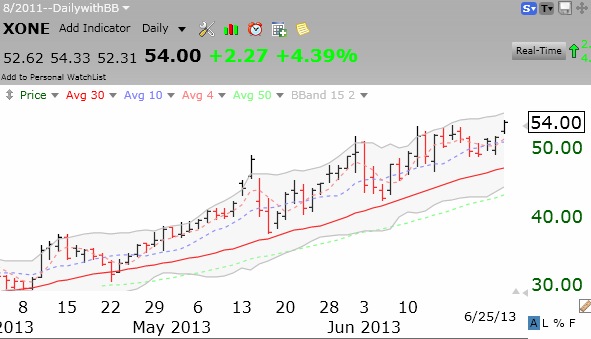
One exception is I own a few shares of XONE. It actually hit an all-time high on Tuesday! This is one of Judy’s picks. See the daily chart below.
Six charts came up in my new high and good earnings scan: DWRE, WAGE, CBOE, PRXL, PRLB, ALGT. Stocks that can come through the current market decline and be at new highs are worth researching.
I am trying to re-create the post I lost last night.
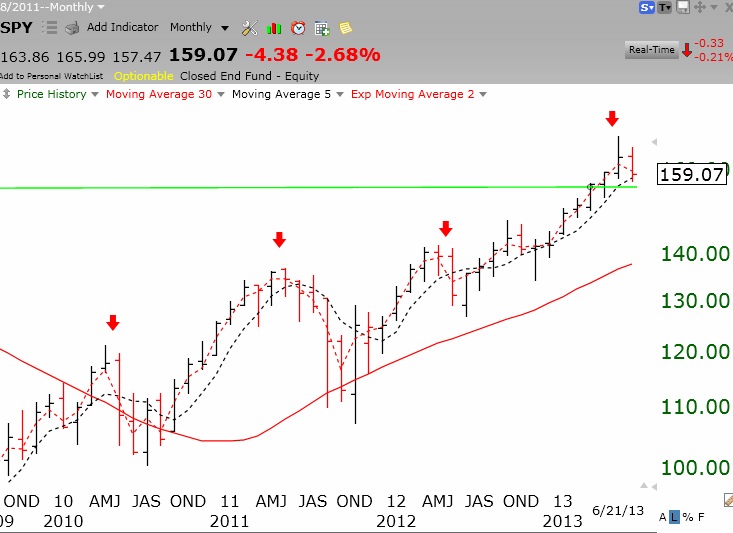
We may have thought that we had escaped the “Sell in May and Go Away” curse. But look at this monthly chart of the SPY that I updated last night. The red arrows designate the month of May. I had written last year that it appeared that the months following May have declined in recent years. The main exception was 2009, when the market was coming back from a huge decline. But in 2010, 2011 and 2012 it held true. And now it looks like we may have hit a peak in May, and June is declining. May had been such a strong month, we thought we had escaped the prediction. Stay tuned…
I have a confession to make. I was trying to minimize the risk of being whip-sawed in my short term trend count. I adopted a new criterion for a change in the short term trend of the QQQ. In doing so, I missed the beginning of the current decline. So I went back to my original method and counted the down trend from where it would have begun. A number of you questioned the D-8 count I posted last night, so I am going to correct things. Using my original short term trend change criterion, the short term up-trend that began on April 23rd ended on June 5th after 31 days (U-31). This was followed by a 2 day down-trend (D-2) and a 2 day up-trend (U-2). On June 12, we started a new short term down-trend which reached day 9 (D-9) on Monday. So I did have two short term trends that lasted for only 2 days. This whip-saw also occurred in IBD’s market call during this period, so I feel a little better. I have always written that I tend to trust a new short term trend more after it reaches day 5. So I am willing to accept more whip-saws in order to not miss the beginning of a real change in trend. I will not change my criteria again without informing all of you who watch me so closely… (thank you)
I use the short term trend to guide my short term trading. The best time for me to go long is when the GMI is on a Buy signal and the QQQ short term trend turns up. The GMI is now on a Sell signal and the short term trend is down, so I will not hold long positions now. When the GMI has flashed a Buy signal, I like to accumulate TQQQ as soon as the short term trend turns up. When the GMI flashes a Sell signal, and the short term trend turns down, I like to start buying SQQQ. It is too late for me to begin buying SQQQ, now that we are in the 9th day of the short term down-trend. Note that the Worden T2108 Indicator is now at 16%, quite low.