TSLA swooned after it released its earnings Tuesday night. When a leading stock like TSLA plummets, it can be an omen of things to come. It remains to be seen whether SCTY can hold on after it reports Wednesday night.
 Dr. Wish
17th day of QQQ short term up-trend; Elon Musk’s companies TSLA and SCTY shine.
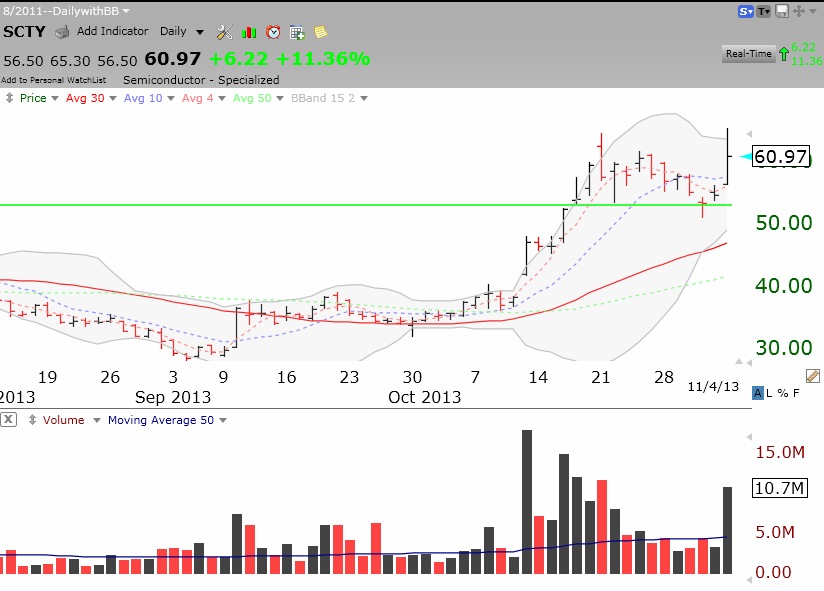
Little did I know that TSLA, which I wrote about on Sunday night, would rebound in one day! Now, what will it do when earnings come out on Tuesday? And SCTY reports this week too. SCTY retested its green line break out and soared on Monday.What do SCTY and TSLA have in common? Answer: Elon Musk at the helm.
Market at critical juncture; MACD and Stochastics weakening; What will TSLA do–buy a call?
This is the time when the Sell in May crowd should be returning to the market. But sentiment is very bullish, with few bears to be seen. And my nieghbor, a great contrary indicator, is now looking to get back into the market. The last time he was so excited and wanted to take out a home equity loan to invest was near the 2000 top. To be sure, there are no technical signs of a top yet. But it is possible that we will get some weakness the next few weeks now that earnings are largely out. Let’s see if TSLA rebounds when earnings come out on Tuesday. A number of high flyers have hit air pockets recently , including CMI, SAM, SRCL, ROP, ORLY, NVO, PRAA, and LNKD.
There are a number of technical signs suggesting at least short term weakness. Take a look at this daily chart of the QQQ. I highlighted two areas of concern. Area 1: The daily MACD is showing weakening momentum with the possibility that the histogram will turn negative. Area 2. The fast daily stochastics has turned below the longer stochastics. Both of these indicators are showing weakening strength in the up-trend. (These indicators paint a similar picture for AAPL, not shown.)
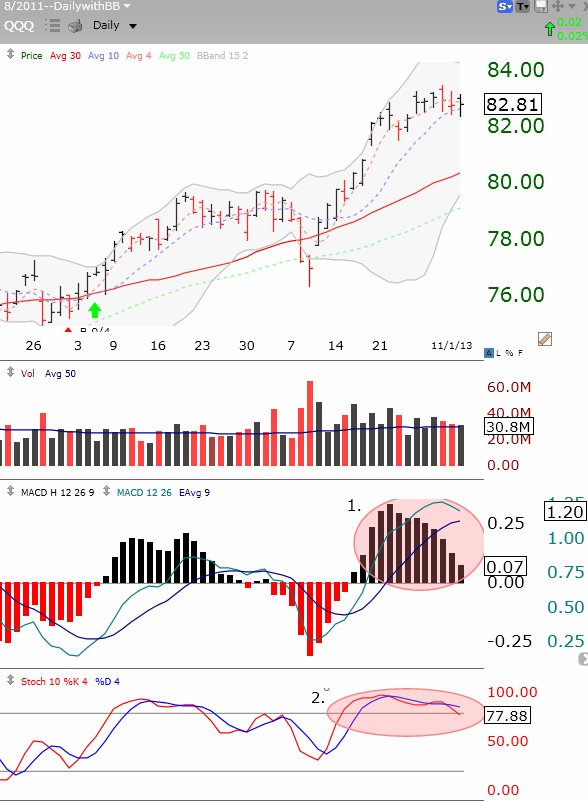 It does not mean that the QQQ short term up-trend will end, only that at least a brief consolidation may be coming……
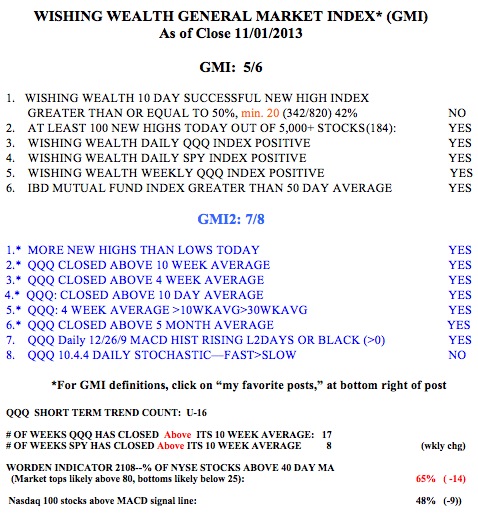
Meanwhile the GMI is at 5 (of 6). However, note that the QQQ has closed above its 10 week average for 17 weeks. That is a long time. The Worden T2108 is at 65%, down from a high of 82% reached on 10/22.
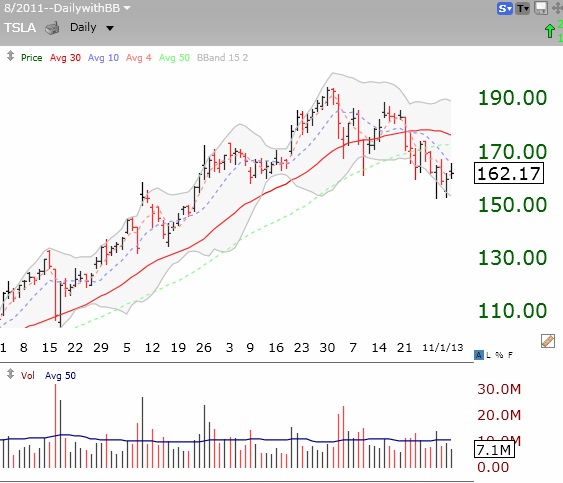
 TSLA just found support at the lower Bollinger band that I follow (15,2). But it is below its declining 30 day average (red line). Will this level hold when earnings are released on Tuesday? TSLA closed at 162.17 on Friday. November 8, 160 weekly calls are expensive, at around $10.75. Break even on these calls would therefore be at $170.75 (160+10.75) , excluding commissions. Can TSLA break 170.75 by Friday? Stay tuned….