With the GMI registering less than 3 for two days, it flashed a Sell signal Monday night. Some Sell signals have been fake outs before. I am waiting to see if this new QQQ short term down-trend can last for 5 days before I go short the market in a big way.
 Dr. Wish
GMI Successful 10 Day New High Indicator Predicted Current Decline; $T2108 indicator, $AAPL
As you know, I like to focus on stocks breaking to new 52 week highs. Strength usually begets strength. One of the things that my stock gurus (Livermore, Darvas, O’Neil) have noticed is that when a lot of the the types of stocks they traded broke out and did not continue higher it often provided advance warning of the weakening of a market up-trend. Failed break-outs in strong stocks are ominous. This idea was behind my creation of the GMI Successful 1o Day New High Indicator years ago as one of the 6 GMI components that I track daily. The GMI Successful 10 Day New High Indicator measures the percentage of stocks that hit a 52 week high 10 days ago that closed higher today than they closed 10 days ago. It is very conservative because all it asks is for a stock to be up at all over its price 10 days ago when it hit a new high. If at least 50% of all of the stocks that had hit a new high 10 days ago pass this criterion, then the indicator is positive and adds a point to the GMI. I post this indicator weekly in my GMI table, see below.
Over the past few weeks the GMI was at 5 (of 6) a lot of the days, mainly because the Successful 10 Day New High Indicator was negative. I decided to look more closely at how this indicator behaved recently. From May 22nd until July 3rd, the GMI Successful 10 Day New High Indicator was positive (at least 50% of stocks passed) for all but one of these 29 trading days, or 97% of the days. The one day that the indicator was negative was because only 47% of stocks had passed. On July 7 and 8 the indicator was negative for 2 days in a row (44% and 42% passed). From July 7 until August 1, this indicator has been negative for 17 of the 19 trading days, or 89% of the days. The last day this indicator had a positive reading was July 24 (56% of stocks passed). This indicator has been negative for the last 6 days.
Maybe my stock gurus were onto something! However, keep in mind that it is folly to place one’s bets based on just how one indicator has performed, but the performance of this indicator is one of the reasons I was in cash or short last week and made money in my trading accounts. Another warning sign was described in my post last Monday…….
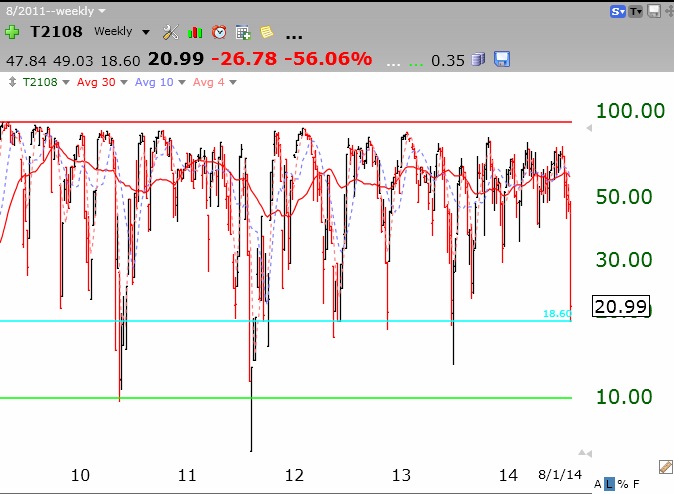
So what is the Worden T2108 indicator showing? This indicator measures the percentage of all NYSE stocks that have closed above their simple moving average of closes the past 40 days. I post its value every day on this blog and you can also get it through the TC2000 program or at their free website freestockcharts.com, by entering the symbol T2108. To me, T2108 represents a pendulum of the market. Markets tend to be extended up when the T2108 is above 80%. When it is below 10%, the market is usually close to the bottom of a steep decline. This weekly chart of the T2108 has a red and green line marking these extremes. The market can reverse at any level, but I do know that if the T2108 should again decline to single digits it is time for me to grit my teeth while the market gossip is terrible and buy a market index ETF. (The market, but not all individual stocks, has always recovered.) As this weekly chart shows, the T2108 does not stay below 10% for long. I drew a blue line at the low of the T2108 last week. You can see that during the strong market advance since 2010, the T2108 has traded this low at least once each year. So the current weakness does not necessarily signify the end of the longer term up-trend….
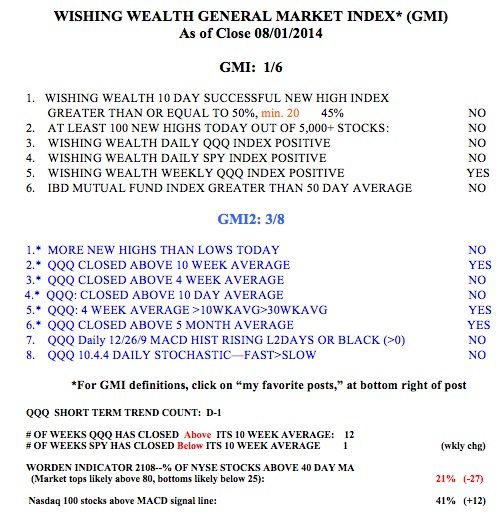
IBD still sees the market “up-trend under pressure.” They have not considered the market to be in a correction. In Monday’s edition, they note the fact that with the put/call ratio at 1.9 on Friday, it is at an extreme level where at least a bounce is likely. The GMI is still on its Buy signal from April 22nd. The GMI measures a mix of short and longer term indicators of the market’s strength. My QQQ short term trend count has now changed to down, after 56 days of a QQQ short term up-trend. Note, however, that QQQ short term down-trends since 2006 have often been very short. Since 2006, about one quarter of new short term down-tends have lasted less than 6 days. When a new short term down-trend begins, I often buy a little of the 3X bearish QQQ index ETF (SQQQ) and add to my position only if the down-trend lasts 5 or 6 days.
After 15 weeks above, the SPY has now closed below its critical 10 week average. The QQQ remains above its 10 week average, reflecting greater relative strength in tech stocks. The GMI is now at 1 (of 6) and if it registers below 3 on Monday, it will flash a Sell signal. The large cap stocks, including banks look very weak and remind me of 2007. I remain largely in cash and a little short in my trading accounts. My university pension is still 100% invested in mutual funds, for now.
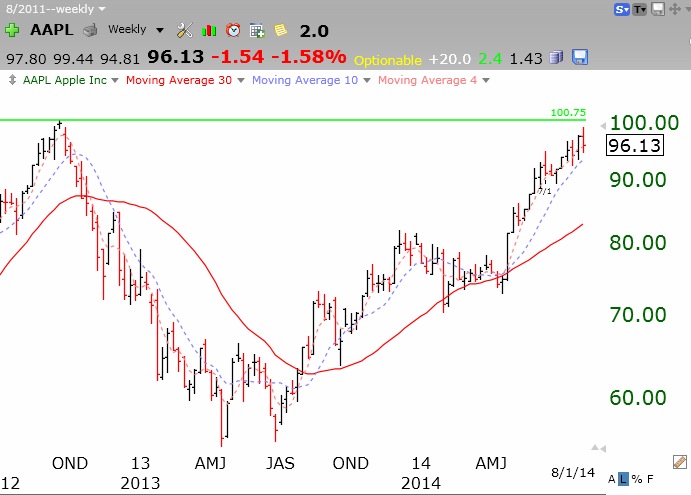
 On more thing. Everyone asks about AAPL and many consider it the “safe” stock to own. But as one of my gurus says, “all stocks are bad unless they are going up.” Over the years, I have found AAPL fine to own as long as it remained above its rising 10 week average. Its 10 week average is now 93.44. A weekly close below that level would concern me. Check out this weekly chart of AAPL, adjusted for its recent split. The 10 week average is the blue dotted line. Click on chart to enlarge.
56th day of $QQQ short term up-trend, but likely to end on Friday; trading 3X bearish index ETF’s
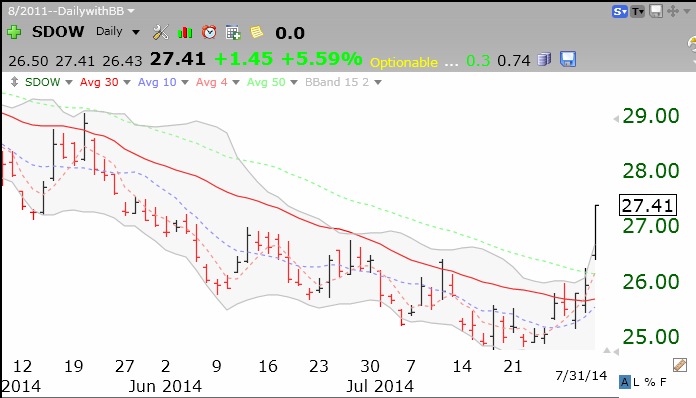
I have been writing for some time that short term up-trends rarely last as long as the current one has. The media pundits are blaming Thursday’s decline on some weak earnings reports. That is garbage! Did you ever notice that they have all the answers after the market has moved! This decline was baked into the market over a week ago. Go back and read my posts about the weakening DOW stocks and the tiring up-trend. On Wednesday I went mainly to cash and a little short the major indexes (SDOW, SQQQ) with two triple leveraged bearish index ETF’s. For example, on Thursday, as the DOW 30 index declined -1.9%, the SDOW rose +5.6% . Check out this daily chart of SDOW:
One has to be very careful with the 3X index ETF’s because they go up and down three times as much as the underlying index. For now, I will hold my positions and average up if the market continues to weaken. The GMI could flash a Sell signal with another weak day on Friday. With most earnings out, we go into the summer lull, culminating in the weak month of September. The longer term trend of the market remains up, however, and I remain fully invested in mutual funds in my university pension—for now.