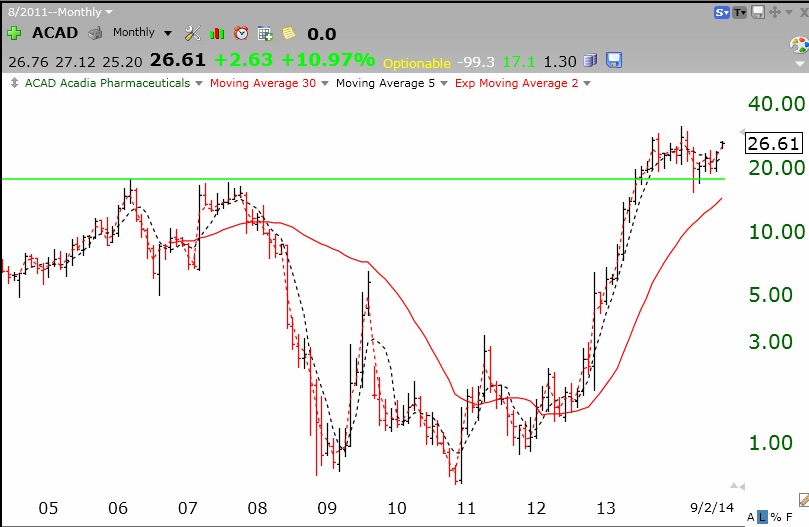
11th day of QQQ short term up-trend; gold turning up?; EHTH gains strength and WYNN retests green line; GMI buy signal leads to large gains

GMI6/6
GMI-27/9
T210879%

The market remains in short and longer term up-trends.   I hold a position in TQQQ , protected by put options.   This should be an interesting week with earnings expected from AAPL and FB.   I think GLD (ETF for gold) looks like it may be turning up.   Check out this daily chart.   Among the positives are that GLD is now back above its 30 day average (red solid line), the past 7 days have had large volume up days, and the MACD histogram has turned positive (black bars) the past 6 days.   I own   call options on GLD. Click on chart to enlarge.

GLDdaily10252013

I noticed that EHTH has been having some high volume advances after its recent green line break-out.   Obamacare’s problems   may be good for its bottom line.   Check out this daily chart. T o find out more about green line charts, watch my free TC2000 December 2012 webinar.   A link to the webinar appears to the right of my post.

EHTHdaily10252013

On Friday, WYNN had a high volume retest of its green   line break-out.   Will it hold? Here is its daily chart.

WYNNdaily10252013

Finally, here is the GMI table, which shows a lot of strength in my indicators.   The GMI has been on a buy signal since the close on September 4.   Since then, the QQQ has advanced +8.07%, the QLD +17% and the TQQQ +25.92%.   In contrast, the SPY has advanced only +6.15% and the DIA +4.2%. Riding a leveraged index ETF during a sustained up-trend has proven very profitable to me. Of course, my put options protect my position and let me sleep at night. Check out the performance of the GMI based strategy here.

GMI10252013R


10th day of QQQ short term up-trend; TSLA at critical point

GMI6/6
GMI-27/9
T210880%

For the first time since its green line break-out last April, TSLA may close below its critical 10 week average (dotted blue line). Other danger signs are closing down 3 weeks out of the last 4 on elevated volume (red bars) and the weekly MACD histogram has turned negative (red), revealing weakening momentum.   TSLA bounced from oversold levels on Thursday.   If TSLA closes below yesterday’s low of 162.83, I would expect more of a decline. If it holds this level then I think it is a shake-out, to be followed by a resumption of the up-trend. Pre-market, TSLA is up. It remains in a Stage 2 longer term up-trend, with support around 123 (red line). Earnings are expected on Nov. 5. What do you think? (Click on chart to enlarge.)

TSLA10252013