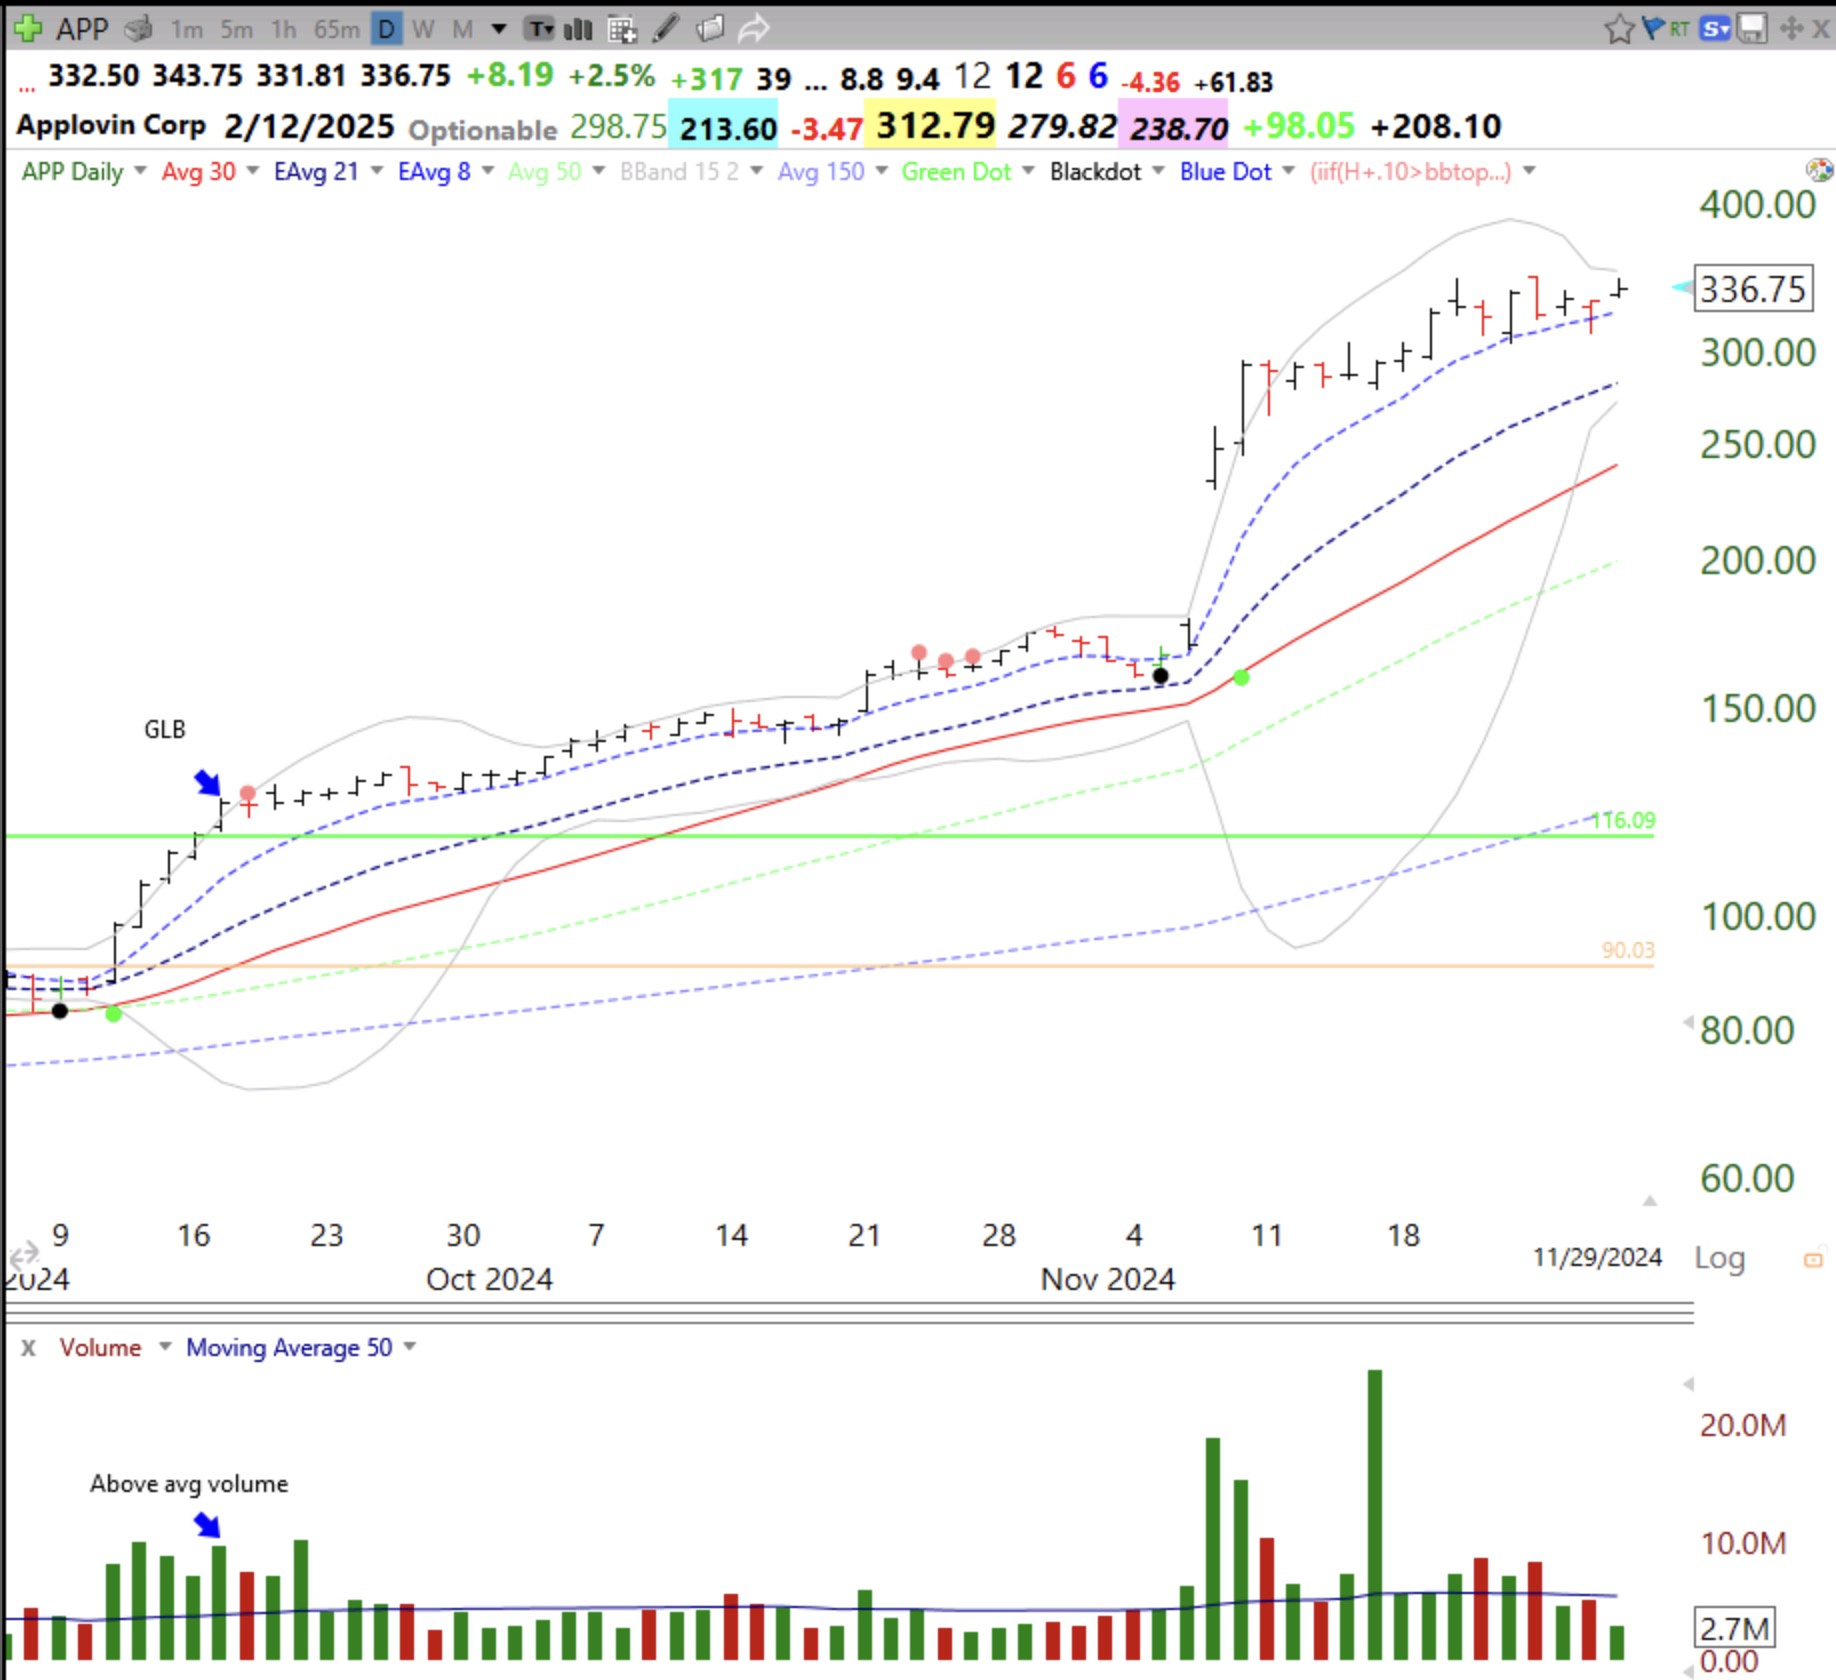
APP had a high volume GLB on September 17, 2024.

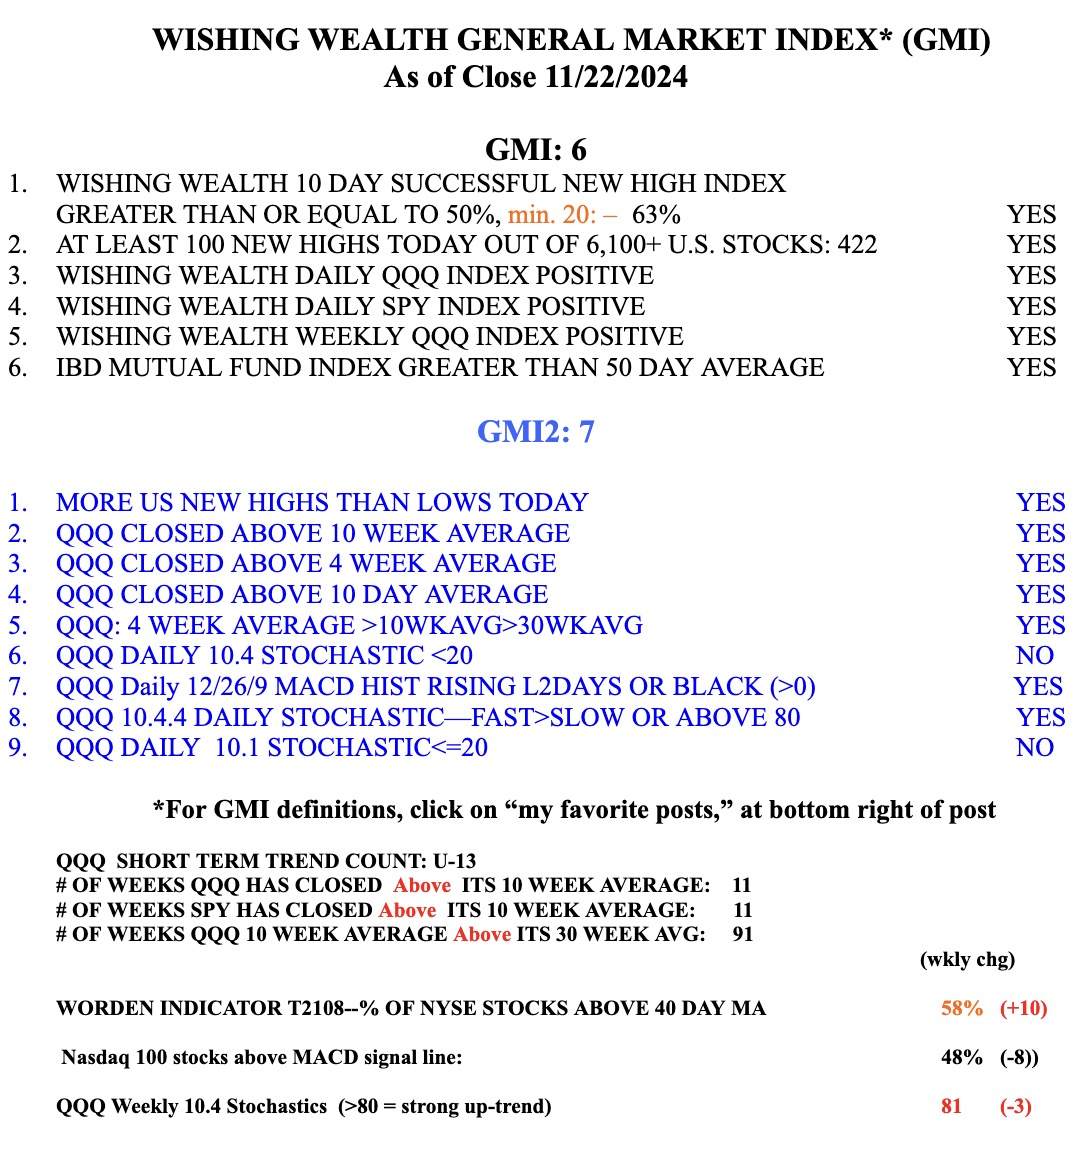
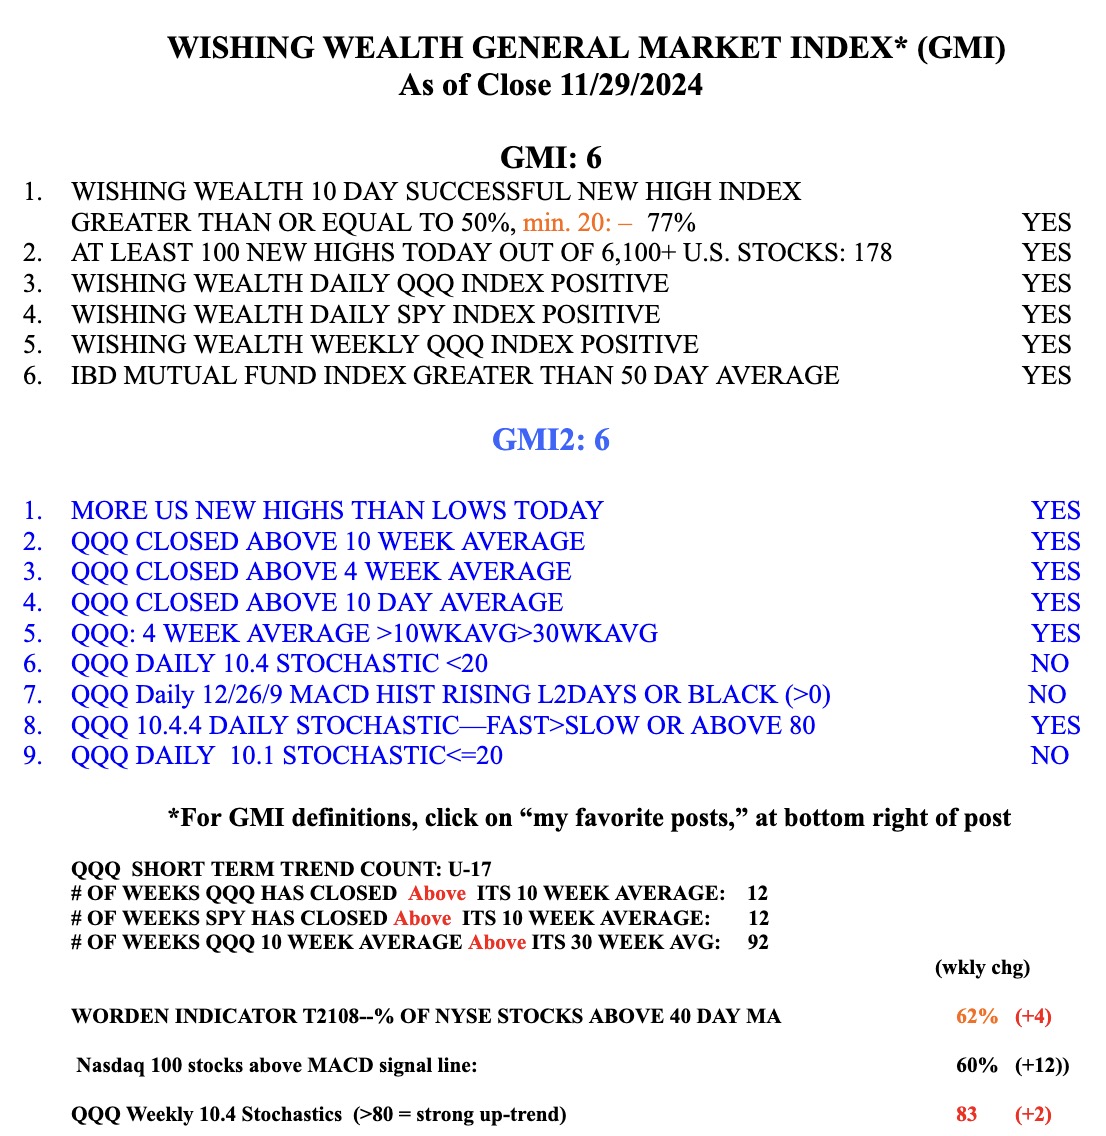
And below is the GMI table.
Stock Market Technical Indicators & Analysis
APP had a high volume GLB on September 17, 2024.
And below is the GMI table.
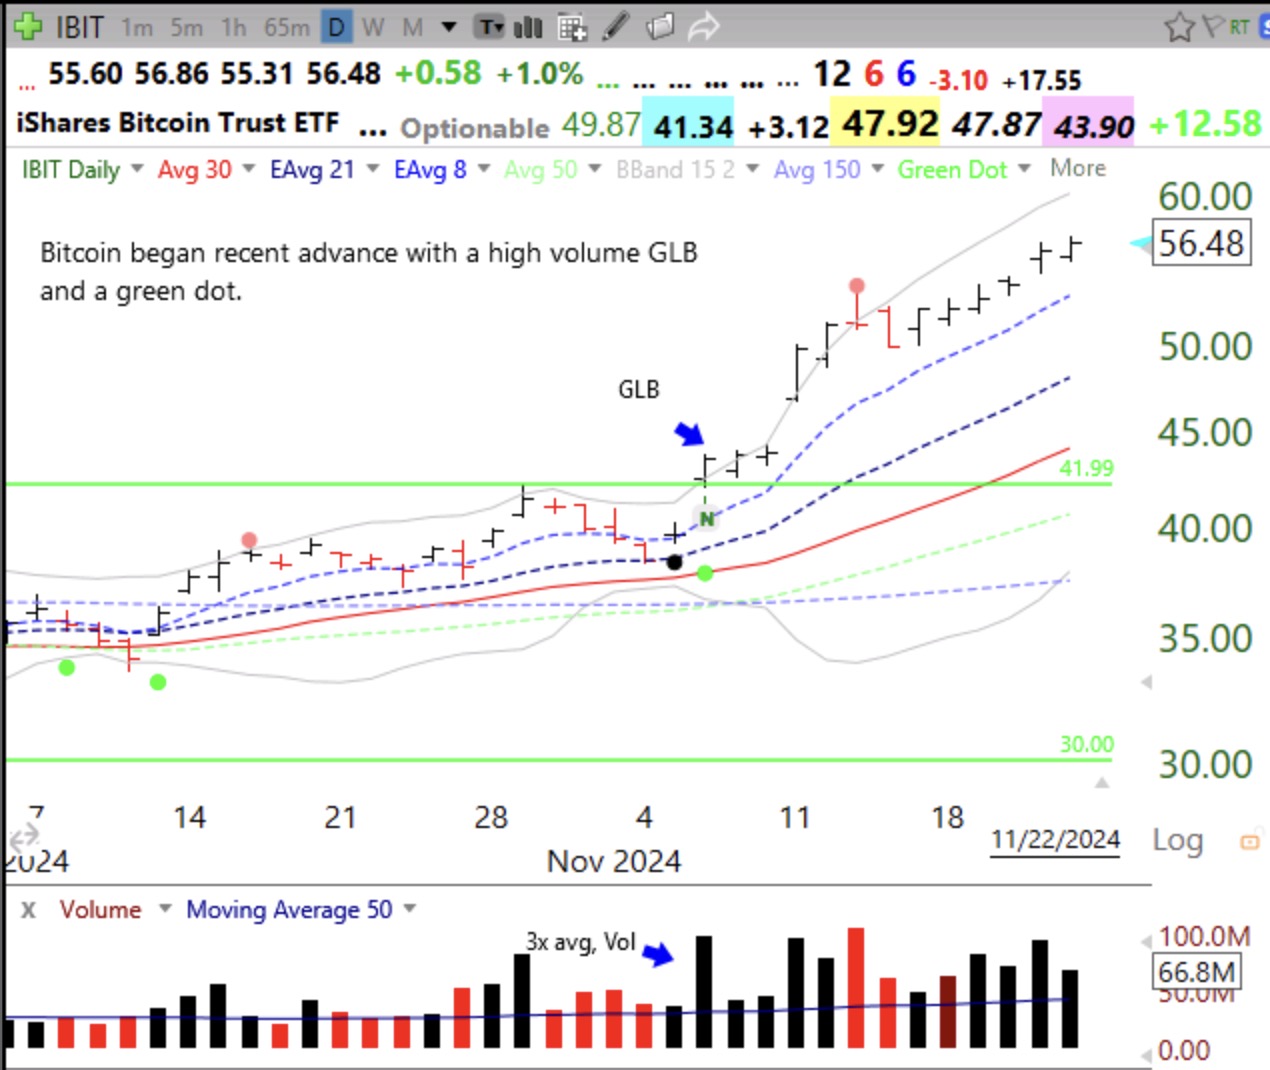
The start of the recent advance in bitcoin was marked by an unusually high volume green line break-out (GLB) and a green dot showing a Stochastic 10.4 and 10.4.4 crossover. I noted when it happened that it looked like a promising “flag” pattern, see monthly chart. The “N” designates a note I entered in TC2000 on the daily chart.