Be careful. A lot of stocks I follow are extended and reversed down on Wednesday.
 Dr. Wish
35th day of $QQQ short term up-trend
This market is getting red hot–T2108 is at 75%. Major indexes traded above their top Bollinger Bands on Tuesday. I am raising stops. I do not want to give up a lot of my gains.
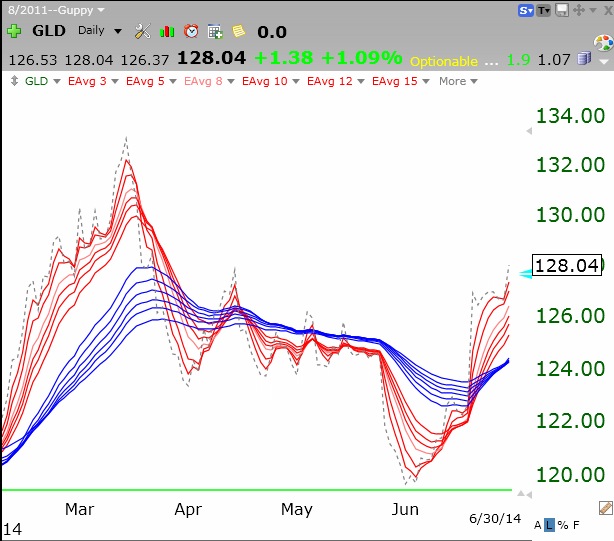
34th day of $QQQ short term up-trend; $GLD rising again
This daily GMMA chart shows the renewed strength in GLD. All of the short term averages are above the rising long term averages (blue lines). It also shows a beginning RWB pattern. Click on chart to enlarge.