GMI is back to 5.
 Dr. Wish
GMI signals “Buy”
It is very difficult for me to fly by instrument, but the GMI has just issued a Buy signal. Talk about head fakes! I am mainly in cash in my trading accounts and making small bets.
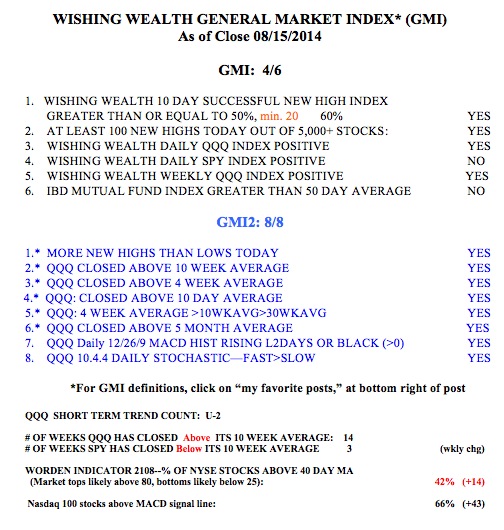
New $QQQ short term up-trend
If the GMI holds 4 or more on Friday, it will flash a Buy signal.