All of my GMI components remain positive.
 Dr. Wish
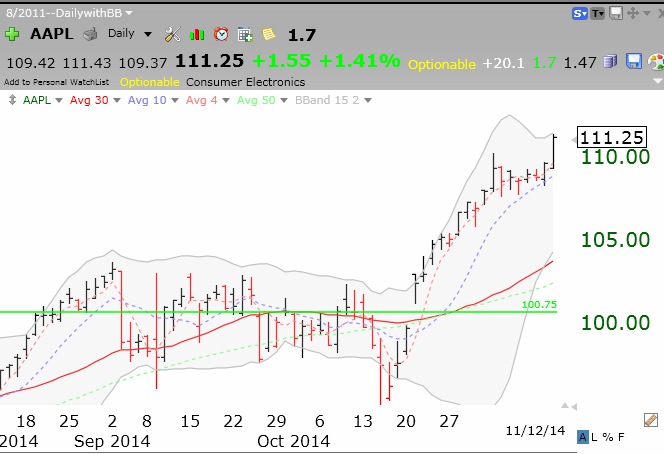
14th day of $QQQ short term up-trend; $AAPL continues green line break-out
After breaking above its green line, AAPL continues to strengthen.
Stock Market Technical Indicators & Analysis
All of my GMI components remain positive.
After breaking above its green line, AAPL continues to strengthen.