Sorry for this late post. With the GMI2 at 4 (of 8) half of these sensitive indicators are now negative. And with earnings out and the AAPL event completed, this market may have little to propel it higher until 3rd quarter earnings come out. But let’s not forget the Fed’s impending tightening.
 Dr. Wish
$OILT– cup and handle break-out; 16th day of current $QQQ short term up-trend; $IEF signals interest rates to rise?
OILT came up on my TC2000 scan for rockets bouncing off of their 10 week average. When I looked at it, it appears to have broken out of a cup and handle base on Thursday on unusually high volume. Check out this daily chart:
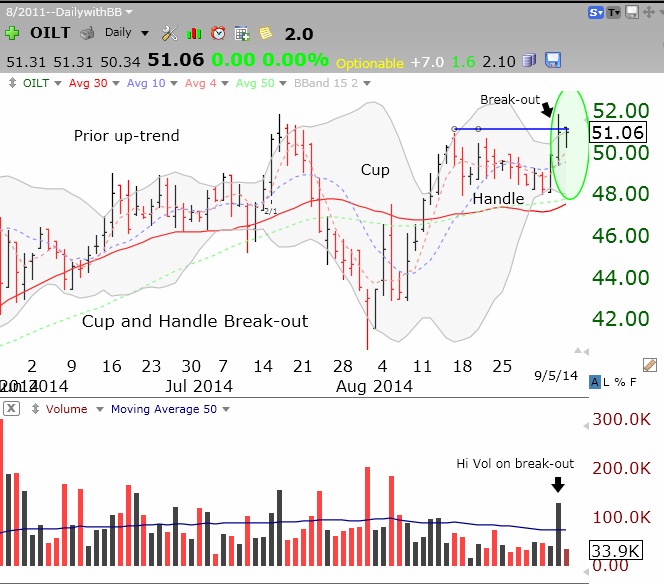 OILT closed Friday right at the pivot point. If I bought it here and it trades back below 49, I probably would exit.
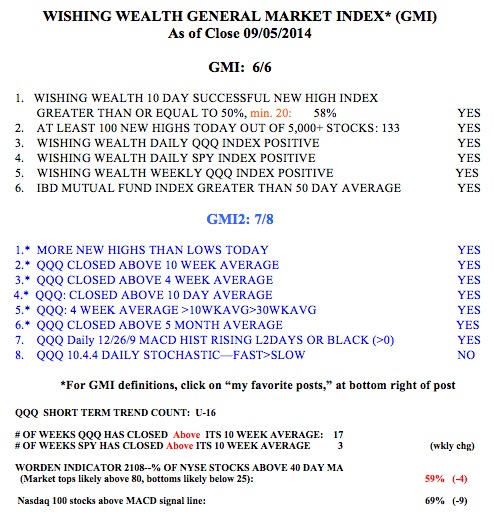
Meanwhile the market remains in an up-trend, with the GMI at 6 (of 6).
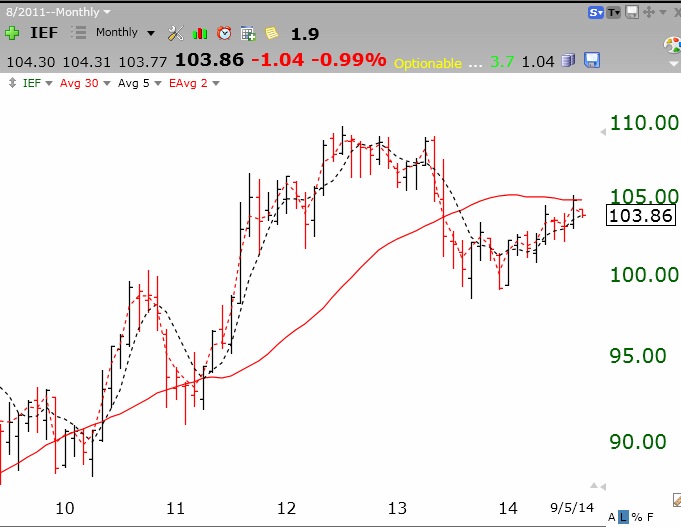
 My biggest concern is that the Fed will start raising rates and kill this market. This monthly chart of the 7-10 year treasury bond ETF (IEF) is very ominous. Note that the 30 month average (red line) is now flat and could be starting to decline, after many months of advancing. IEF has now spent 16 months below this moving average. The IEF has not traded like this since 2005-2007, and we all know what happened to the markets after that. Are bond traders warning us of rising rates to come? (When bonds decline, their yields, (or interest rates) rise.)