The excitement about Apple and Alibaba may be diverting attention from the general market’s weakening. The Worden T2108 Indicator, the percentage of all NYSE stocks that closed above their simple 40 day average price has peaked again and started down. Look at this weekly chart of the T2108 (click on to enlarge):
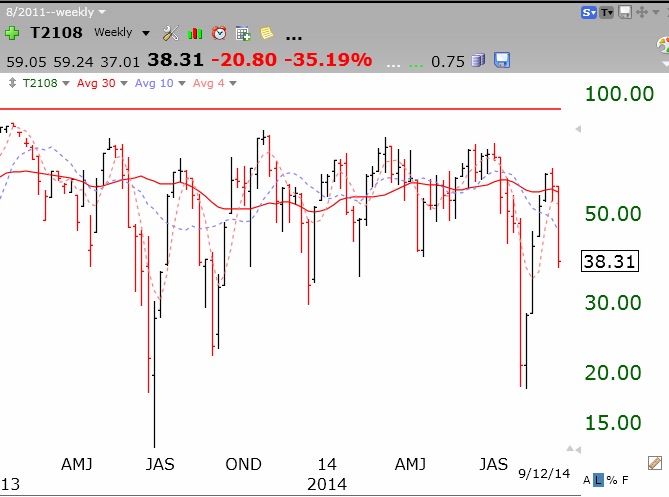 T2108 has peaked recently at 65%, indicating the last rise was not even strong enough to get the T2108 to the more typical 70-80% level.
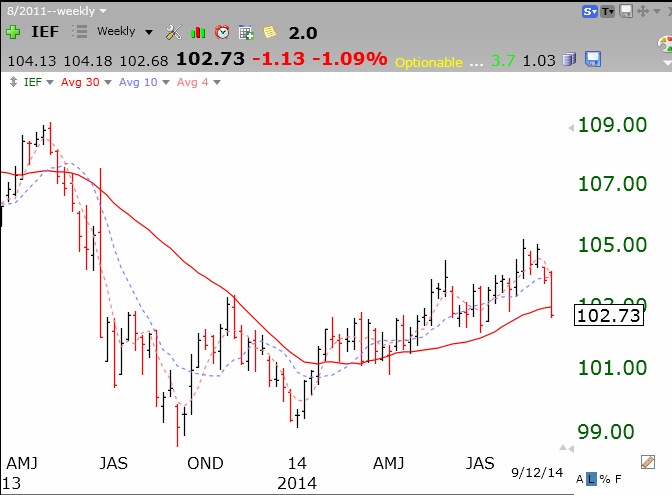
In addition, interest rates on bonds are moving up, as reflected in the decline in IEF, an ETF composed of 7-10 year U.S. treasury bonds. Falling bond prices = rising rates. (Think of it this way. Current interest rate or yield= Constant pay-out/changing current price. As the denominator–the current price of a bond falls, the value of this fraction, or the yield, increases.) Note that IEF has closed below its 30 week average and declined 1.09% last week. The 10 year treasury bond now yields 2.61%. When the Fed meets this week, it could attract attention to rising interest rates. Rising rates hurt the stock market because people will begin to sell their relatively more risky investments in stocks and invest instead in safer, higher yielding government bonds. If retirees can earn 5% or more by keeping their money in FDIC protected CD’s or governments bonds, why should they gamble in the scary stock market roller-coaster? Most bear markets are precipitated by rising interest rates.
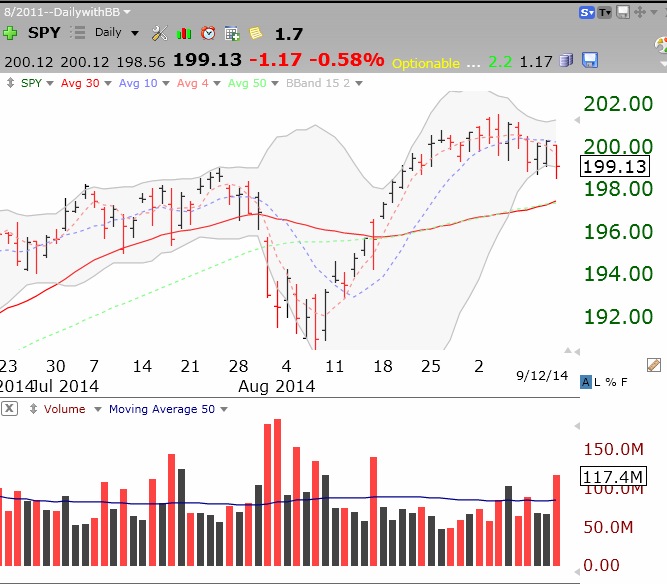
This daily chart of the SPY (S&P500 ETF) shows some ominous patterns. Note the high red volume spikes during the market’s decline in August, followed by the relatively low volume rebound to new highs in September. Now note the large down volume (red) spike on Friday. A break of Friday’s low of 198.56 would likely result in a larger near term decline. Then what?
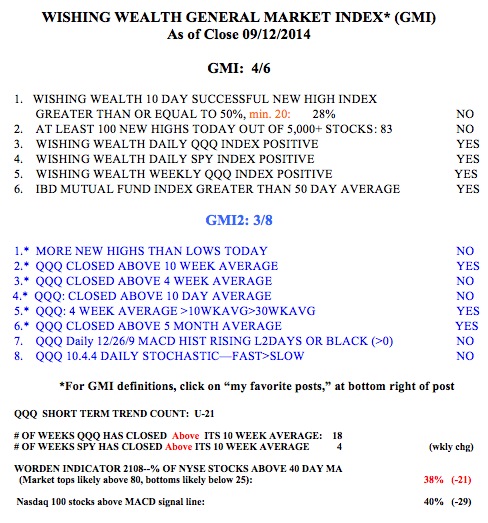
This technical weakness in the general market is also reflected in the GMI-2, now at 3 (of 8). It is noteworthy that the GMI is at 4 (of 6) and still on a Buy signal since August 14. However, the two components of the GMI that are negative are very telling. Fewer than 100 stocks reached a 52 week high on Friday and less than 50% (only 28%) of the stocks that hit a new high 10 days earlier closed Friday above their closing price from 10 days earlier. Failed break-outs in strong stocks can be an early sign of a weakening market. And this is the wonderful, famously weak September/October period.
So what to do? I am mainly in cash in my trading accounts. I remain fully invested in mutual funds in my university 401 (K) accounts, pending further signs of weakness. I remain cautious in the midst of the Apple and Alibaba euphoria.