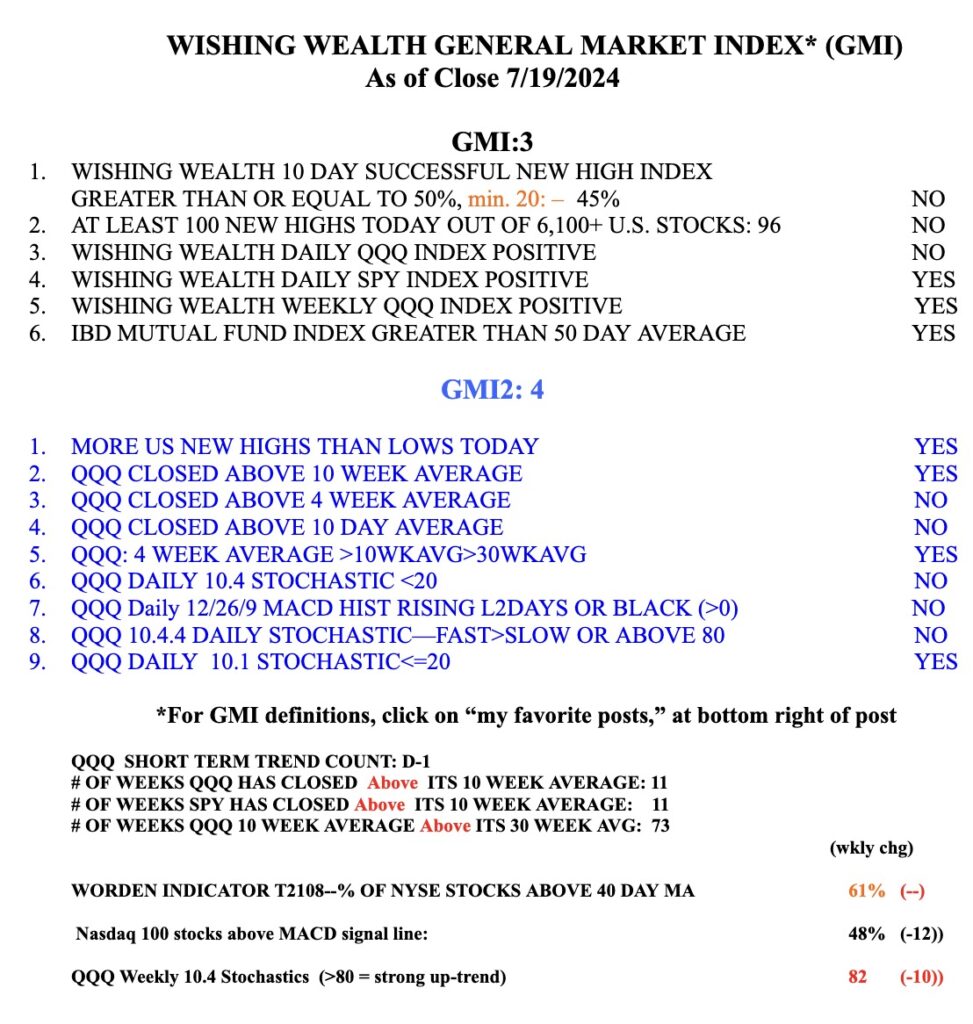
Blog Post: Day 67 of $QQQ short term up-trend; 115 new US highs and 44 lows; 11 stocks have OSB after recent ATH, see list, which includes $NVDA and its chart, see also recent OSB, $AMPH

GMI5/6
GMI-24/9
T210856%

These stocks reached an ATH recently and have had an oversold bounce, indicated by a black dot. They are sorted by close/lowest price past year. Interesting, NVDA is at the top. If I buy any OSB, I place an immediate stop below the bounce. Note the earnings dates. Holding through earnings has been treacherous lately, see QCOM and SDGR.

My OSB setup worked recently for AMPH.


Blog Post: Day 65 of $QQQ short term up-trend; 149 US new highs and 23 lows; treasury bonds cratering, see $TLT and chart showing duration of QQQ up-trends

GMI6/6
GMI-27/9
T210868%

As bonds fall rates go up. Something is off. Could this be related to the Fitch  downgrade? Look at the red spikes. The market cannot fight rising rates. The QQQ short term up-trend, at 65 days is getting old. Most end before this, see chart below for 2006-2019. The end of a short term up-trend does not necessarily signal the beginning of a large down-trend, only a short term down-trend.