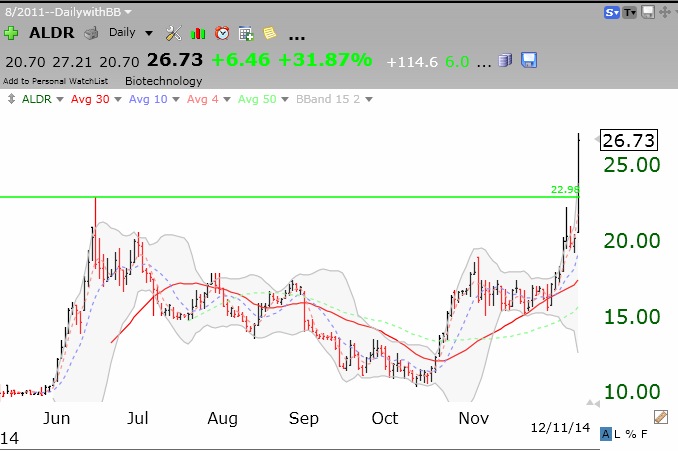
QQQ, DIA and SPY are all on support. Friday will tell the resolution. Meanwhile, in the midst of all of this market volatility, ALDR had a green line break-out to an all-time high on Thursday.
Stock Market Technical Indicators & Analysis
QQQ, DIA and SPY are all on support. Friday will tell the resolution. Meanwhile, in the midst of all of this market volatility, ALDR had a green line break-out to an all-time high on Thursday.
I wrote yesterday that it was critical that Tuesday’s bounce up off of support needed to hold on Wednesday to continue the short term up-trend. It did not, with the SPY and DIA leading the QQQ lower. Tuesday’s bounce was totally reversed. I am largely in cash in my trading accounts now as I wait for the dust to settle. (During Tuesday’s bounce, I had closed out my hedge in SQQQ.) So many people have been counting on a strong end of year. This weakness could set that up, but I am not going to bet on it.
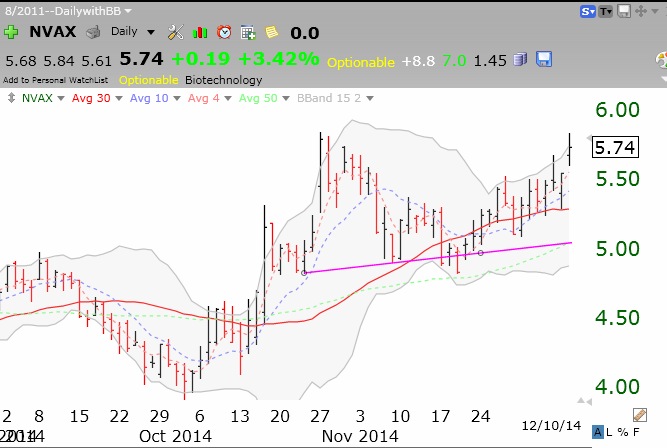
One of my few remaining positions is a biotech which Judy alerted me to years ago. It rose on Wednesday, indicating considerable relative strength. Here is the daily chart for NVAX.
Stocks reversed up off of support. It is critical to this short term up-trend that these levels hold on Tuesday.