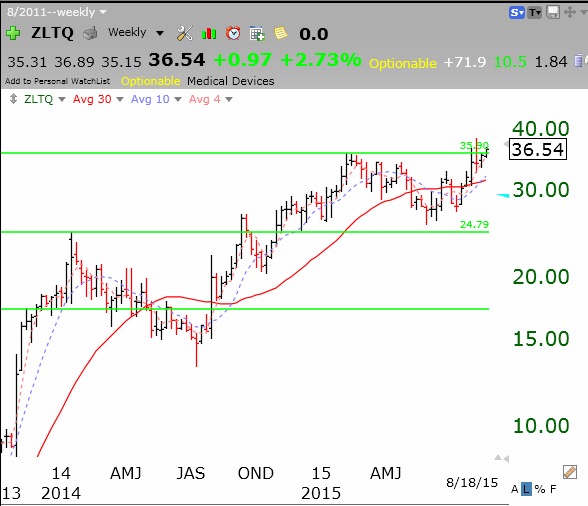
AAPL continues to rocket higher after consolidating for weeks around its green line break-out (GLB). This is a daily chart.
Here is its monthly chart, showing the green line drawn at its multi-month peak in 2012.
Stock Market Technical Indicators & Analysis
I am very tired today after an all-day meeting. Did not watch the market.
In response to a comment left by a reader who questioned the value of the GMI, I am posting a visual of how the QQQ behaved since 2006 while the GMI was on a Sell (red) or Buy (green) signal. You will see that the GMI got me out of the major declines. The cost was that sometimes the GMI gave a false signal and got me out at the end of a short decline. It then got me back in. I think this is a fine trade-off to make in order to avoid the pain of a serious decline. I am a chicken when it comes to trading. (Click on chart to enlarge.)The GMI is now back to a Buy signal as of Monday’s close. Two consecutive closes above 3 yield a Buy signal. Monday was also the second day of the new QQQ short term up-trend.
On September 10, I wrote that RCPT had had a green line break-out (GLB). The stock exploded up after hours on Monday and is trading up about 25%. Check it out on Tuesday. After the close RCPT announced good results on their colitis treatment. This is why technical analysis has value. Somebody apparently anticipated this news and bought into the company huge over a month ago! Their buying was evident in the chart. Here is its hourly chart after Monday’s close. Expect RCPT to open way up on Tuesday.
Speaking of GLB stocks, EW had a huge break-out last week. Check out this daily chart of EW.