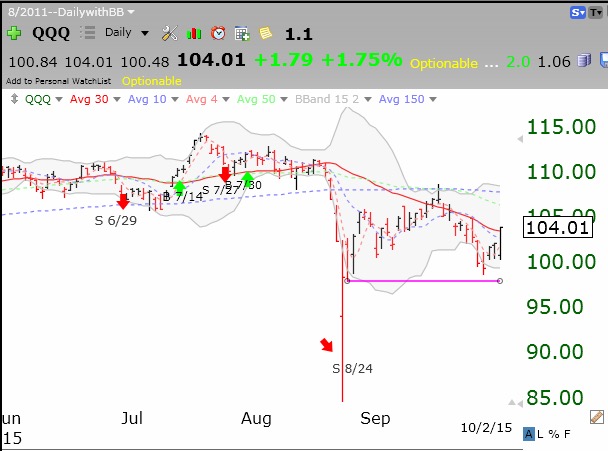
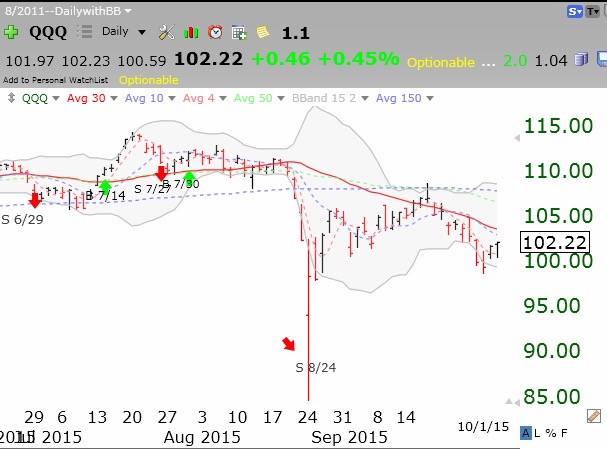
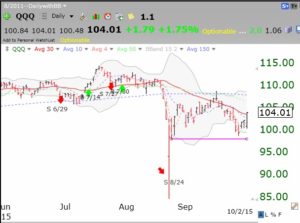
Based on their methodology, IBD says in Monday’s edition that Friday’s rise constituted a follow through day and that they believe that the market is now in a “confirmed up-trend.” I find IBD’s market calls to be analogous to my very short term trend indicator for the QQQ (currently in the tenth day of a down-trend, D-10), which could turn positive with a positive close on Monday. But my short term trend count for the QQQ is NOT the same as my GMI indicator, which remains on a Sell since the close on August 24. It takes much stronger action for my GMI to signal a Buy. This daily chart of the QQQ shows how I assess the short term behavior of this index. Excluding the aberrant technical action during the flash crash on August 24, the QQQ has just re-tested the August 25th low. Note that support came in at the lower 10.2 BB. The QQQ has just crossed above its 30 day average (red line, which is still declining ominously) but faces critical resistance at the 50 day line (declining green dotted) and the 150 day average (purple dotted line). Major resistance is also at the upper BB, around 108.50. If the QQQ could close above this resistance area I suspect the market has really put in a durable bottom, but not until then. I prefer to wait safely on the sidelines. As I told my undergraduate class on Friday, it is far safer and more likely to be profitable if one waits for the signal, rather than trading before it has occurred. The market is not out of the bear infested woods yet. Click on chart to enlarge.
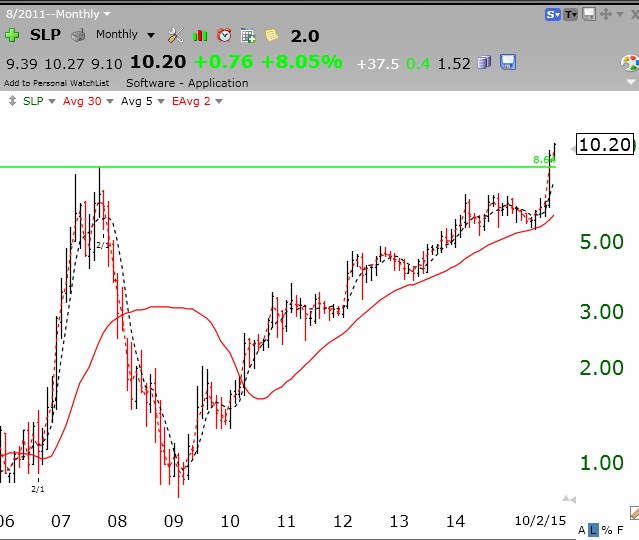
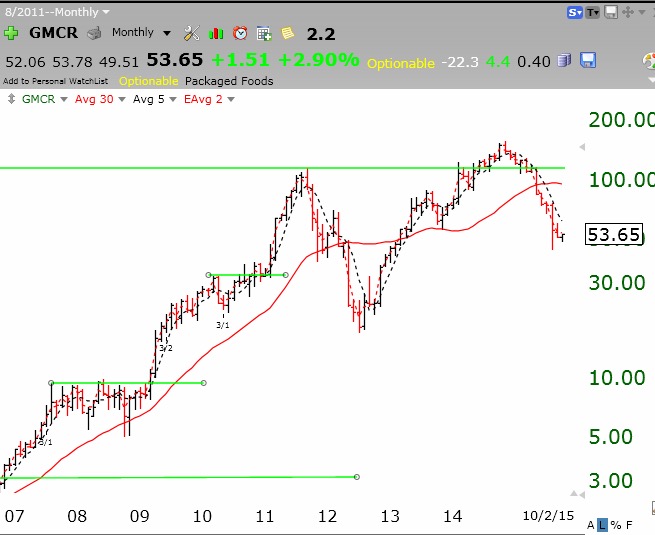
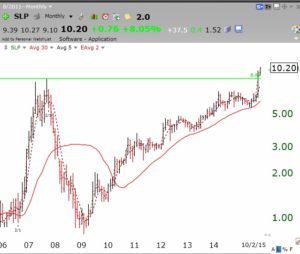
I love weak markets because it is easier to spot potential new leaders. One stock that has been hitting all-time highs in the midst of this declining market is SLP. Note on this monthly chart, that SLP has had a green line break-out, going above the peak it reached in 2007.
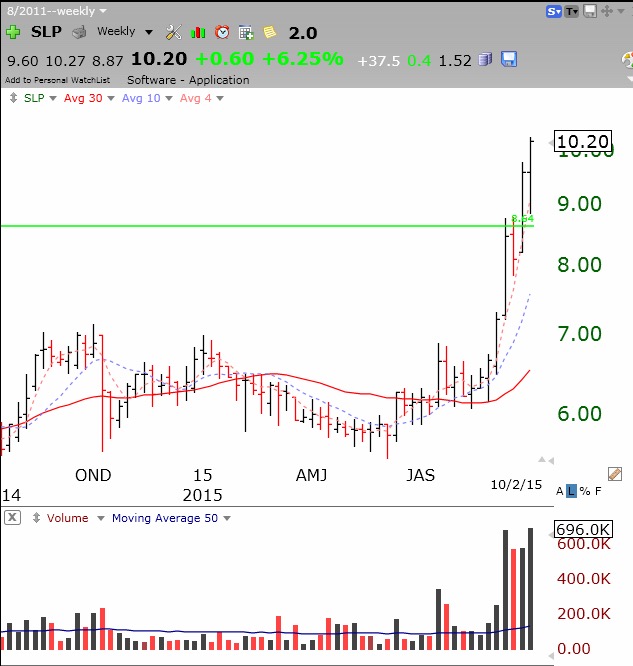
 This weekly chart of SLP shows that it has been rising the past few weeks on unusually high trading volume. One or more institutions are clearly accumulating this stock.
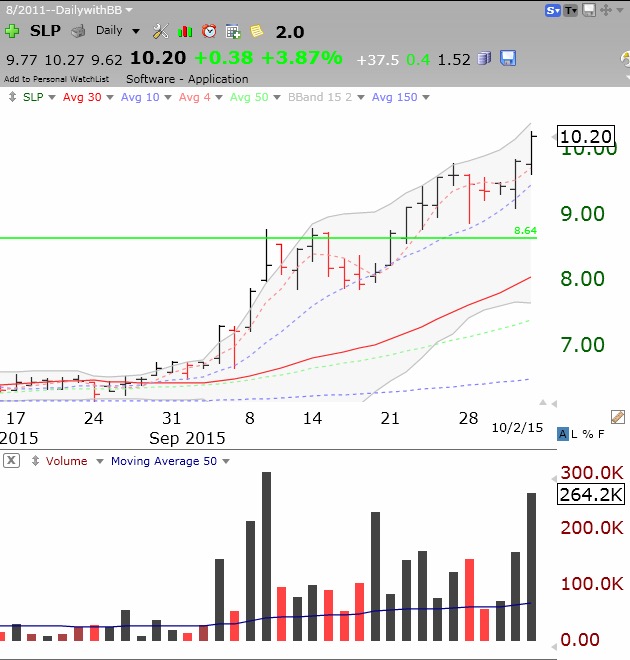
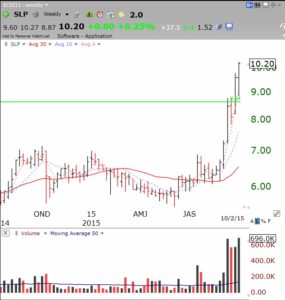 Finally, this daily chart clearly shows atypical buying volume as the stock made the green line break-out, consolidated below it, and then resumed its rise. This is the type of stock that is worth my researching and monitoring for possible accumulation if the market trend turns up. By the way, I never hold a green line break-out stock if it closes back below the green line. I may, however, buy it back if it re-takes the green line with good technical action.
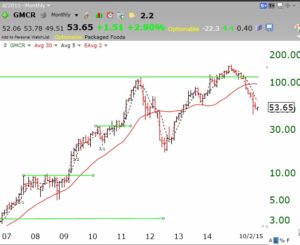
 It was an analysis like this that put me onto GMCR when it had its green line break out in March 2009 at the end of the 2008 market decline. There were only a handful of stocks hitting all-time highs at the time. GMCR went on to become a 10 bagger over the next three years. Will SLP???