On the sidelines.
 Dr. Wish
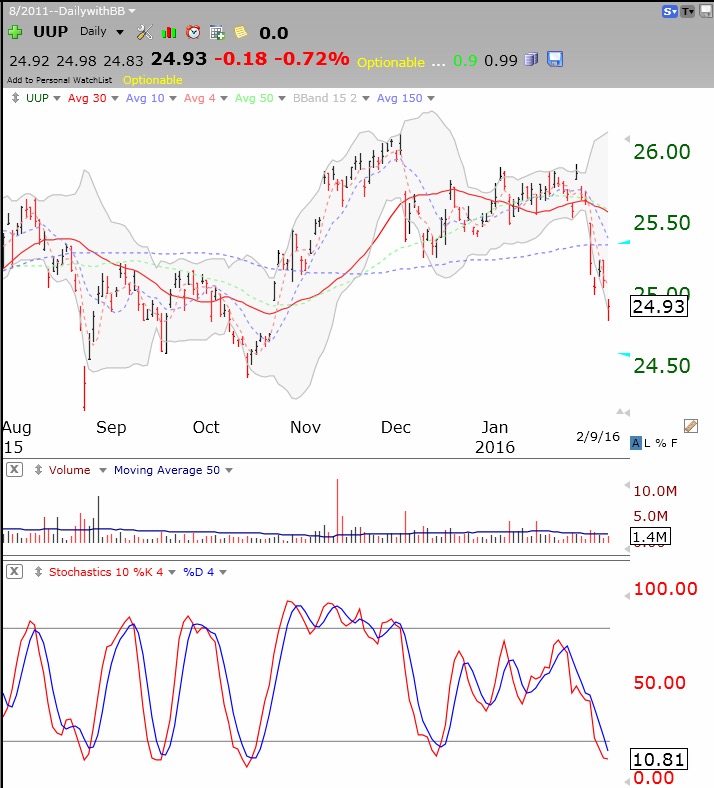
26th day of $QQQ short term down-trend; dollar over-sold; dollar to bounce, gold to weaken?
Expect a bounce in UUP (US dollar). Note the daily 10.4.4 stochastics is below 20, a point from which UUP has bounced several times. UUP is also below its lower 15.2 daily Bollinger band. GLD (gold) should therefore weaken too.
25th day of $QQQ short term down-trend; GMI performance
Here are my GMI signals applied to the QQQ the past two years and since inception. Click on charts to enlarge. (Past performance does not guarantee future performance!)
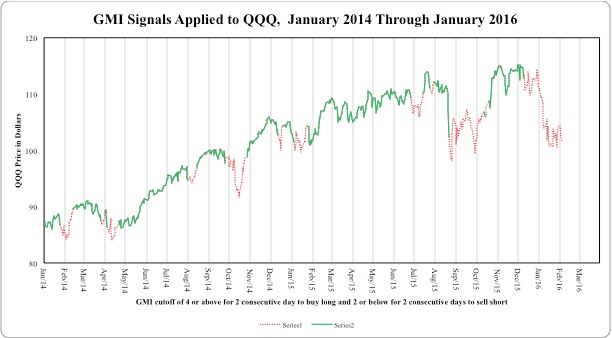
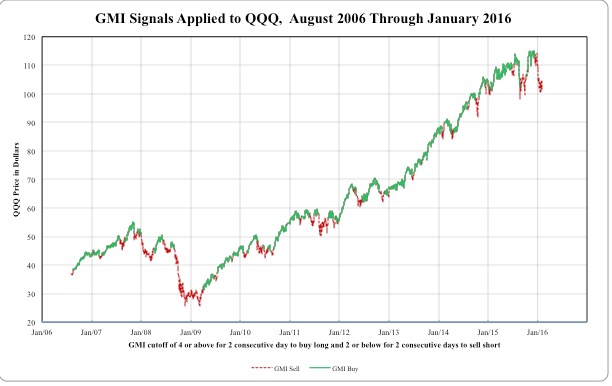 The GMI issued its last signal, Sell, on December 10. (My QQQ short term trend count, currently at D-25, is based on a much more sensitive and short term count.)