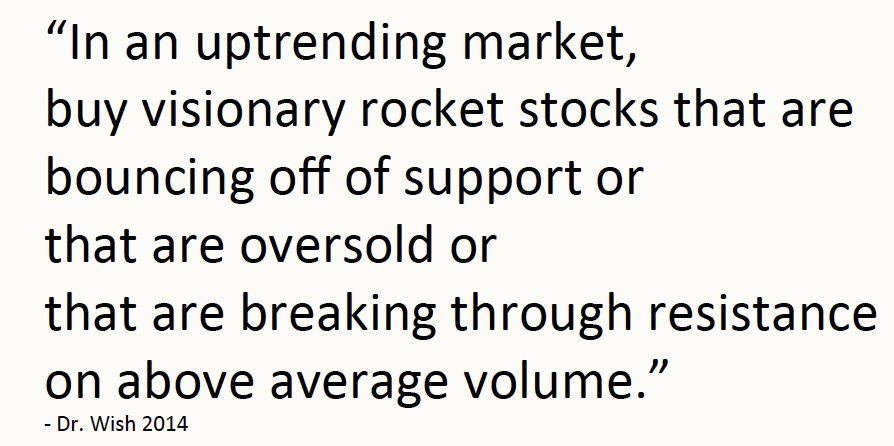
The primary trading approach from my course on technical analysis that I teach undergraduates is contained in the following quote from yours truly:
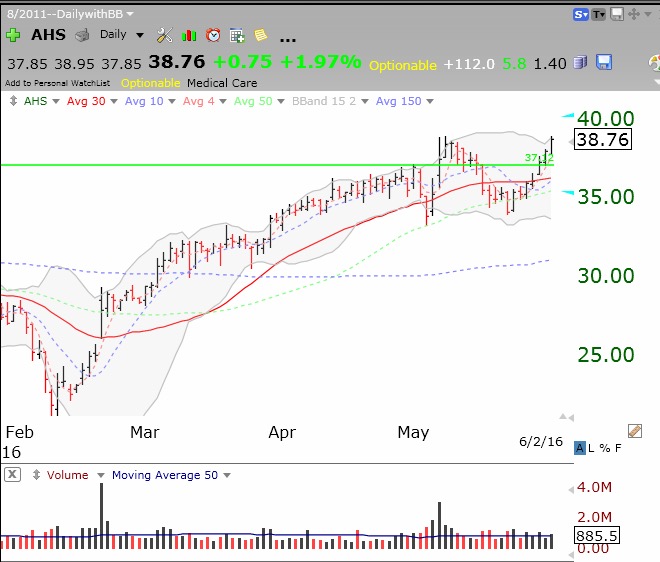
 I have for years been stressing the break-out strategy at the end of this quote. (Who quotes himself?) Buying stocks breaking out of a base and through resistance is highlighted in the works of successful traders I have emulated, like Nicolas Darvas, Jesse Livermore and William O’Neil. (Their exceptional books are listed on this blog.) Each trader defines a base somewhat differently, however. For me, it is defined by a green line breakout (GLB). I draw a green line on a monthly chart at a stock’s all-time high that has not been penetrated for 3 or more months. This defines an advancing stock that has rested or consolidated. I then become interested in the stock the moment it exceeds its green line top, preferably on unusually high trading volume. I set alerts on TC2000 to signal me when a GLB occurs. I have recently taken to tweeting GLB alerts intraday. The major problem with GLBs is they often fail and equally important, it is not really easy to define in advance a price at which I think will indicate the break-out has failed and I should exit. I usually try to exit if the stock that has a GLB closes back below its green line. So many of the GLBs occur when the stock is overextended and it soon retraces and I get (rightly or wrongly) scared out.
Over the past couple of years I have developed an alternative set-up for buys that seems to work very well for me in an advancing market (GMI on a Buy signal or QQQ short term trend is up). I actually like this strategy better than trading GLBs. As the first part of the quote above states, in an advancing market, I find a strong rocket stock that has become oversold and/or is on support. I programmed TC2000 to alert me when a stock meets my criteria (rocket stock and not extended) if the stock trades up. (This set-up I label Bounce on Support, BOS.) If I like the stock, I buy it and place an immediate sell stop order in below the bounce or the support level. I really like this approach because my stop or exit level is typically quite close to where I entered, so I likely risk little. I know that a good percentage of these entries will fail, but the name of the game is to lose very little when it fails, to exit quickly, and to retain stocks that behave. I do not know in advance which BOS position will succeed. No one really knows that. So I take an unemotional and detached attitude, making my purchase, setting an immediate sell stop, and then letting the market decide whether I will profit or lose. This really is a succinct summary of where I come out after a 50 year journey of trading stocks.
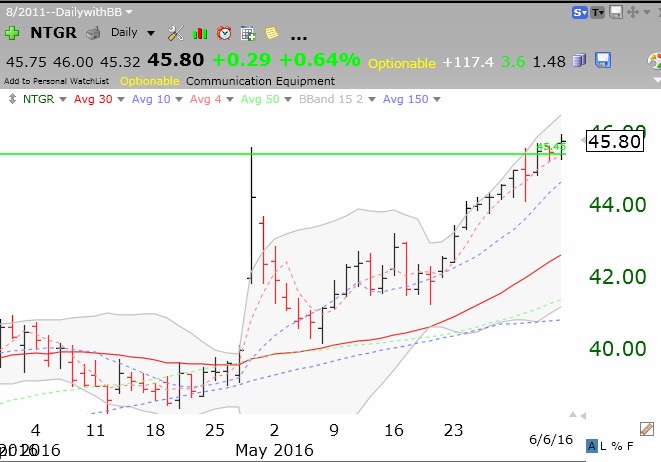
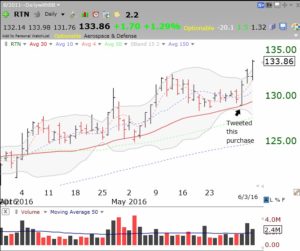
I have newly embraced tweeting some of my stock alerts intraday. (If I begin tweeting, this mode of communication must have peaked!) You can sign up to receive my intraday tweets here: @WishingWealth. My goal, as always, is to teach people how I systematically trade stocks and manage risk and not to make trading recommendations or to sell anything. I often have already researched a GLB or BOS stock long before I receive an alert. So I am ready to act. Many of my stocks come from the IBD 50 list. Everyone must design their own set-ups that are consistent with their tolerance for risk and financial situation. My tweets appear each day on my blog site, www.wishingwealthblog.com, but they come much quicker and directly to people who have signed up to follow me on twitter. So last week I tweeted that I bought RTN and placed a sell stop to exit if the stock traded back below 129. Take a look at the daily chart of RTN. RTN never looked back–yet… Can you guess why it is a BOS?
 I define support or oversold levels on the basis of a few criteria which I will not specify here. (Ask my undergraduate students!) Just keep in mind that not every BOS will work out. When I tweet a BOS alert, I will also specify the price at which I think it would have failed and where I would place my stop loss order. When a BOS position succeeds, I must then decide where to raise my sell stop to. Sometimes I may not raise it at all, if I want to try and ride a strong stock that I have been waiting for an entry for, or to avoid being whipsawed. Other times I might raise my sell stop to a level that will likely prevent a gain from turning into a loss. This is where science ends and the art of the trade begins….
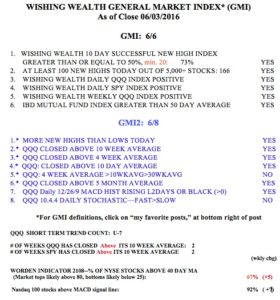
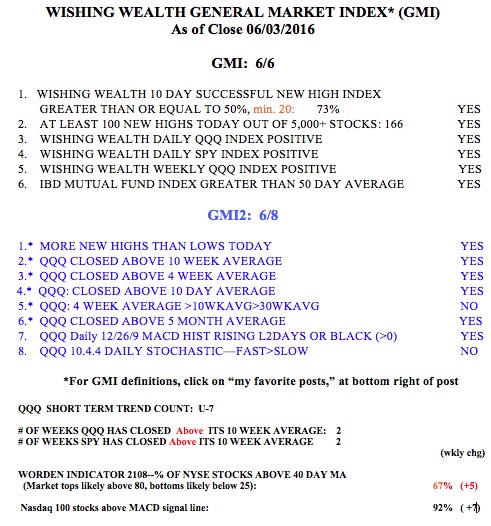
Friday was the 7th day of the new $QQQ short term up-trend and the General Market Index (GMI) remains at 6 (of 6). As long as my market indicators stay positive I will tweet some of my alerts for GLBs and BOS. By the way, you can check out the performance of selected recent GLB alert stocks on the right of my blog page. Many are doing well, as the market is in an up-trend.