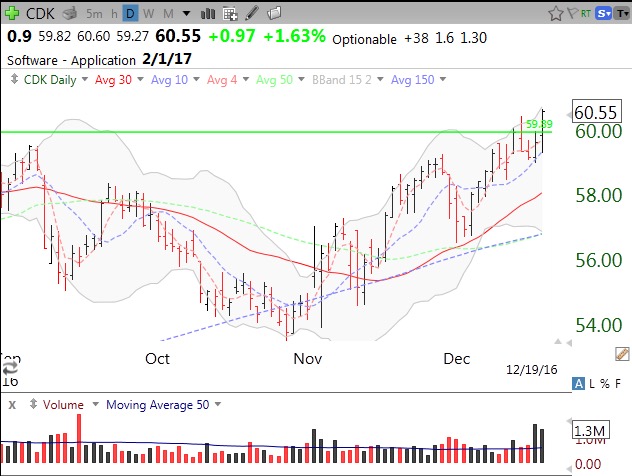
CDK had a GLB to an all-time high on above average volume on Monday. See this IBD review.
Stock Market Technical Indicators & Analysis
CDK had a GLB to an all-time high on above average volume on Monday. See this IBD review.
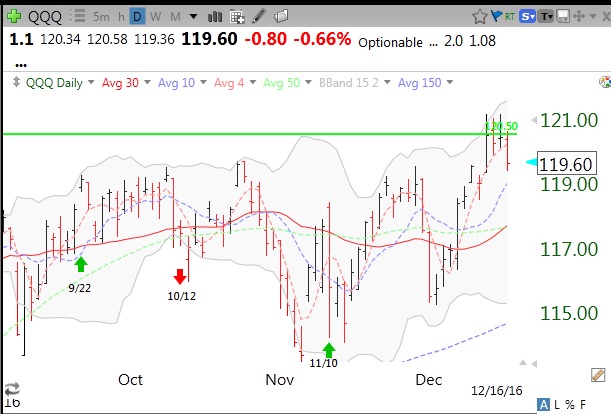
As this daily chart of QQQ shows, at the close on 11/10 the GMI turned from Red to Green. The table below shows how stocks and ETFs have done since the close on 11/10 through the close on 12/16.
If one had bought the following index ETFs at the close on 11/10 one would be up these percentages:
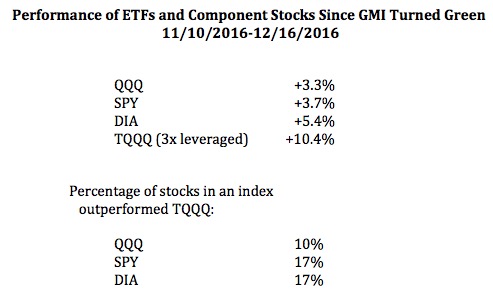
The SPY (+3.7%) and DIA (+5.4%) outperformed the QQQ (+3.3%) presumably because the underlying index (NASDAQ 100) contains no financial stocks, which have led the current rally. However, the triple leveraged ETF, TQQQ, as usual, beat all of the regular indexes during this rally, up +10.4%. We again find that that only a few, 10%, of the individual stocks in the QQQ beat TQQQ. In other words, the TQQQ outperformed 90% of the component stocks represented by the QQQ and 83% of those in the DIA and SPY. Yet again, we see how easier it may be to just ride the TQQQ in an up-trend rather than trying to pick in advance the minority of stocks that will beat it. Of course, what goes up 3x as fast also declines 3x as fast…………
The GMI remains at 6 (of 6). Note in the daily chart of the QQQ above, that QQQ is bumping up against its green line, the all-time peak reached in March, 2000. When (not if) it closes above 120.50, it will be a green line break-out (GLB), and only positive for me as long as it stays above the green line.