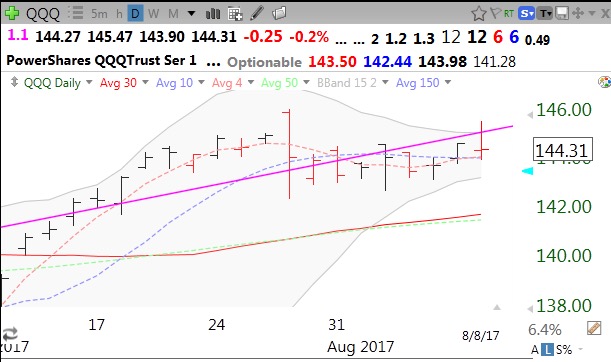
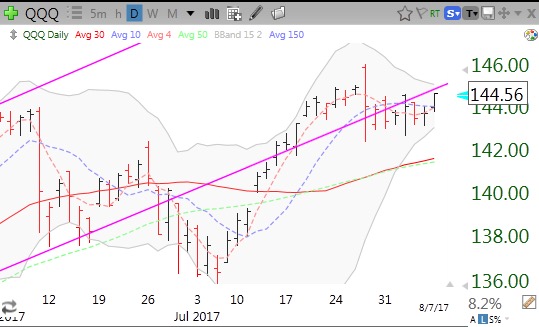
QQQ still holding between 15.2 daily Bollinger Bands.
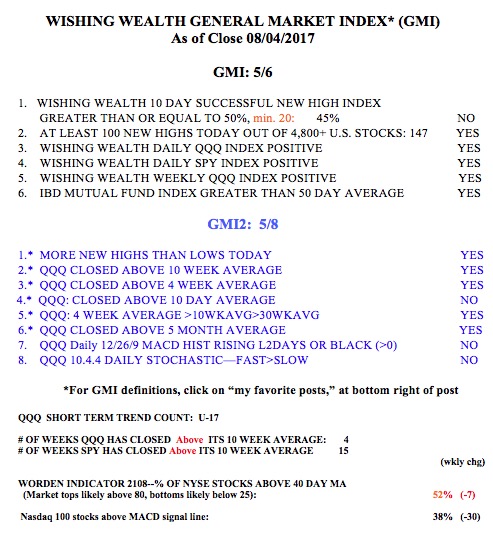
Stock Market Technical Indicators & Analysis
QQQ still holding between 15.2 daily Bollinger Bands.
Will QQQ break through upper 15.2 daily Bollinger Band?
When you get la leading stock like AAOI suddenly collapsing it suggests to me that there are more air pockets that will burst.
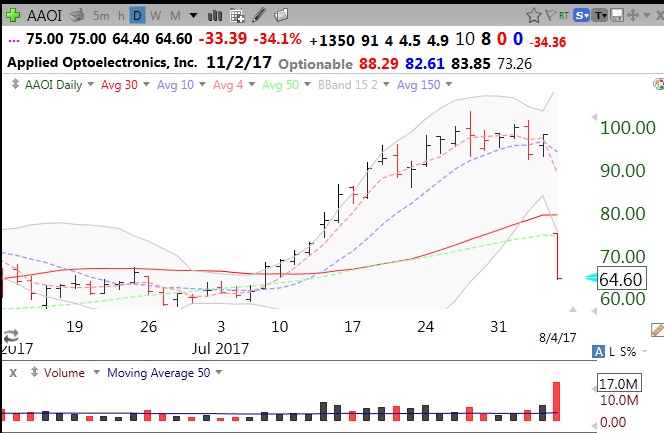
And look at INGN
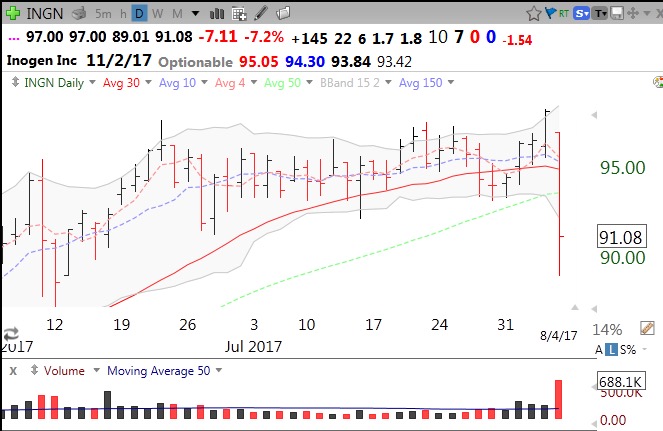
I know that the trend in the averages remains up. But with so many stocks collapsing as they announce earnings, I think that we will have a rough post earnings period coming up. September can be a cruel month for bulls. I remain in cash in my trading accounts but 100% invested in my university pension.