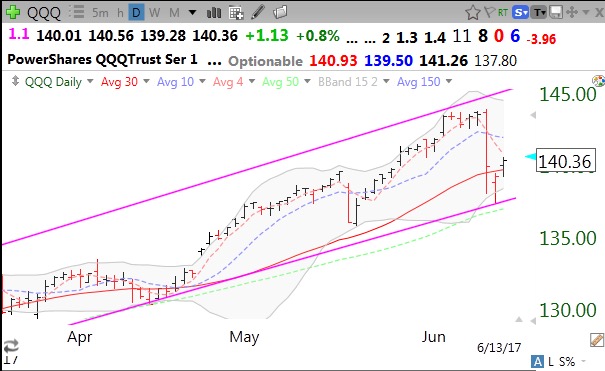
Indexes holding up thus far.QQQ has held support.
Stock Market Technical Indicators & Analysis
Indexes holding up thus far.QQQ has held support.
The QQQ found support right where it should have. Now let’s see if it can hold.
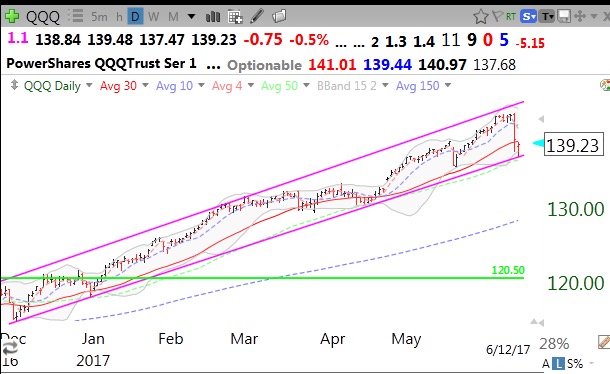
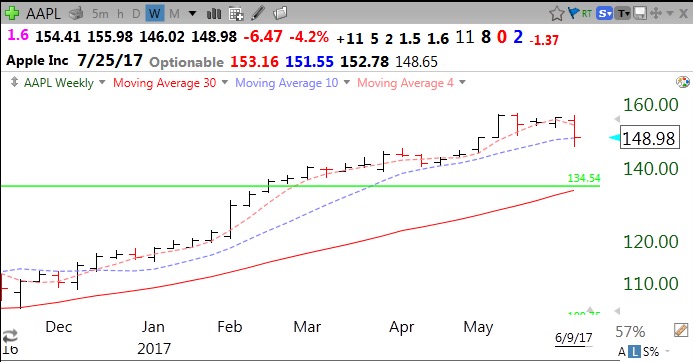
It remains to be seen whether there will be a follow-through on Friday’s tech wreck. Many of the tech stocks had gone vertical on their daily charts and they merely fell back to support. It remains to be seen whether Friday was the start of something more meaningful. A good example is AAPL. This weekly chart shows that AAPL has closed above its 10 week average (blue dotted line) for 27 straight weeks. On Friday, AAPL closed right above its 10 week average. A weekly close below its 10 week average would be a sign of technical weakness for me. On the other hand, it would have to close below its 30 week average (red line) for me to conclude that its longer term up-trend is over.
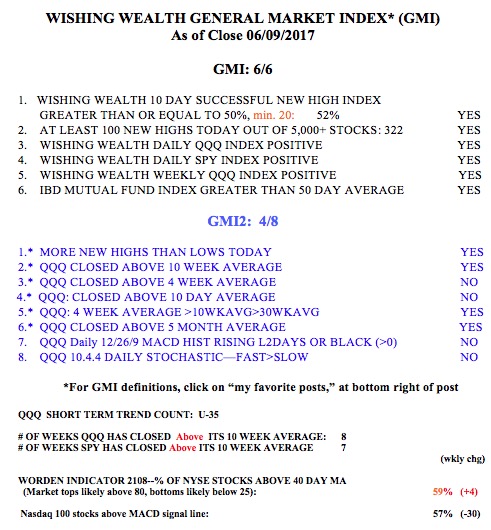
The GMI is 6 (of 6) but the more sensitive GMI2 has weakened to 4 (of 8).