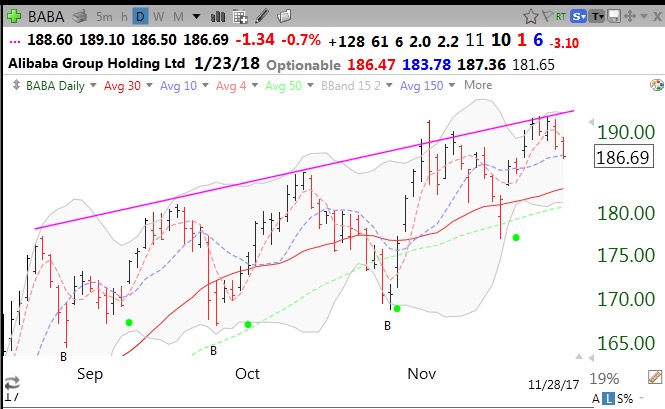
BABA is still unable to break through resistance. (But watch those green dots.)
 Dr. Wish
“Lucky” trading on $SQ?
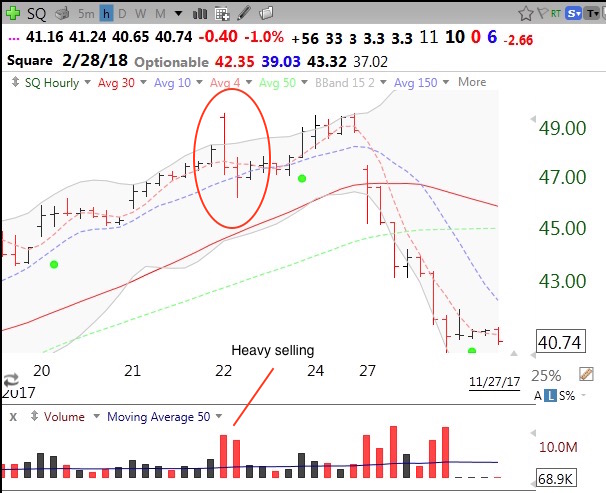
SQ fell 16% on Monday when it received a downgrade on valuation. This hourly chart shows extraordinary high volume selling 2 hours last week on November 22nd. Do you think that these sellers knew something was going to happen this week or were just lucky traders?
18 recent GLBs with earnings up at least +25%;
If you take a look at the GLB tracker table on this page you will see that stocks that closed above their green line (drawn at all time high not surpassed for at least 3 months) sometimes perform very well. I have no idea what percentage of GLB stocks continue to rise. If a stock closes back below its green line I exit immediately. Anyway, below are 18 stocks that had a GLB in the past 2-3 weeks that also had last quarterly earnings up at least +25%. I copied the last quarter’s earnings increase, taken from TC2000, in the second column. These are stocks to watch (I own a few).
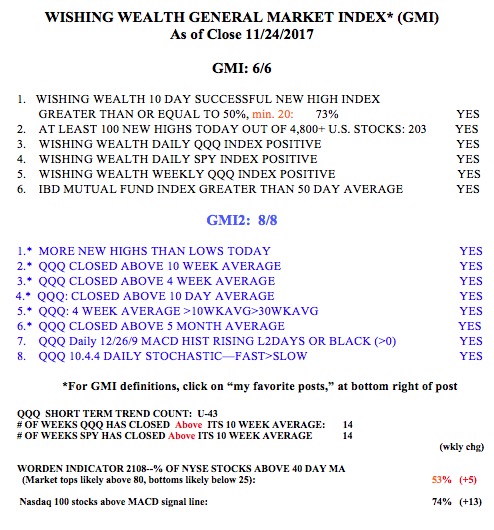
The GMI remains at 6 (of 6) and on day 43 (U-43) of the QQQ short term up-trend.


