I have been writing for some time about the value of the green line break-out, GLB, for identifying strong stocks breaking to all-time highs. Almost every growth stock guru I have valued talks about buying stocks after they have advanced, formed a base and then break out. The idea is to not be a pioneer—one does not want to be the only one interested in a stock. The deep pocketed institutions need to be showing buying interest, evidenced by up days with above average volume. I therefore try to find very strong CAN SLIM type stocks that have rested by forming at least a 3 month base and that then break-out to all time highs, preferably with increased trading volume.
I begin by looking at a monthly chart for each stock that hit a new all time high recently and draw a green horizontal line at the highest price reached at any month, that has not been surpassed for at least 3 months. In other words, I want a stock that reached an all-time high and has then rested for at least three months. When a stock moves through the green line or is above its last green line I become interested. I only buy stocks that are trading above their last green line tops. Stocks that form a multi-month (or multi-year) base at an all time high, especially recent IPOs, often go on to large gains after they break out. (The great Jesse Livermore made a similar observation.)
While it may seem strange, I also like the stock to have already doubled from its lowest price over the past year. This attribute helps, but is not always required, especially for IPOs. The great Nicolas Darvas alerted me to the idea that a stock that has recently doubled is likely to double again. As a psychologist, I have learned that the best predictor of a person’s future behavior is his/her past behavior. The same can apply to stocks.
Why do I buy stocks at all-time highs? Because there are no buyers who bought at higher levels, had a loss, and are waiting to sell out if they can get even. On the other hand, a stock that has advanced to an all time high, rested or declined a little to form a green line top (a base), and then overcomes any overhead supply or resistance to break through to a new all time high (GLB, see blog glossary), is showing real technical strength.
When I speak publicly to audiences of investors I often begin by asking them to raise their hands if they buy stocks at new yearly highs. Typically, fewer than 10% say they do. I then tell them that I only buy stocks at all-time highs! By the end of the semester my undergraduate students have all embraced this strategy.
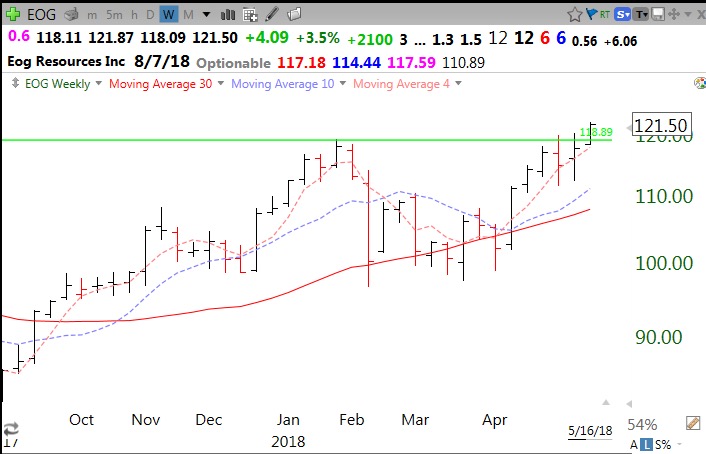
To show you the evidence that GLB’s can work, I am providing below a set of examples using weekly charts. I find that weekly charts are preferable for viewing trends and for keeping me from being shaken out of strong stocks. (I have been told that the great William O’Neil preferred weekly charts.)
Of course, not all GLBs work out. One can never know in advance if a GLB will lead to a significant advance. It does help if the stock showed above average volume at the break-out. I have a strict rule to sell a stock immediately if it comes back below its green line. If I buy because of a GLB, I must get out immediately if the signal fails. It is folly to hang on if the primary reason for buying fails! No hesitation or remorse, because I believe that each loss brings me to the next gain. In some of the examples below there was a GLB failure and a subsequent successful GLB. I find buying back a stock that I exited, after it shows a new buy signal, can be very profitable. It makes sense to buy back a stock that I have evaluated and researched and not to abandon it just because my initial timing failed. (There must be no ego in trading–I accept and study my mistakes.)
Because there have recently been more than 200 stocks hitting yearly highs each day, I have reinitiated the GLB Tracker list to the right to this page. This is a list of stocks that had a GLB in the past week that I will monitor. The date in the table is Friday and not necessarily the day of the GLB. I keep this list as an indicator of how likely recent initially successful GLBs are continuing to rise, not to serve as a buy list. Stocks on the GLB Tracker list need to be researched and evaluated for possible purchase and are not automatic buys. Moreover, I do not have to buy on the exact day of the GLB. The examples below clearly show that if a GLB stock is followed by a few weeks of advance there are many new opportunities to hop on (perhaps at the 4 or 10 week moving averages), as long as I set reasonable sell stops to protect my capital. (Setting stops and exiting is based on one’s personal tolerance for risk and cannot be rigidly defined for everybody, so don’t ask me how to do this.) Study these examples:
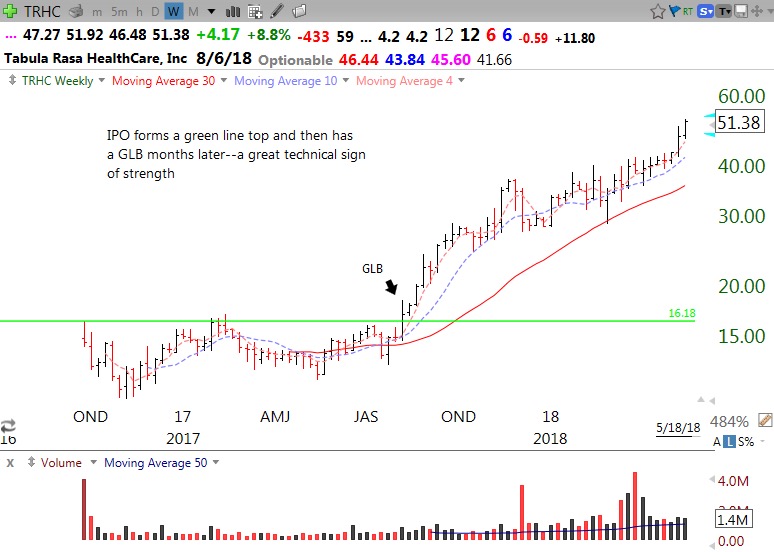
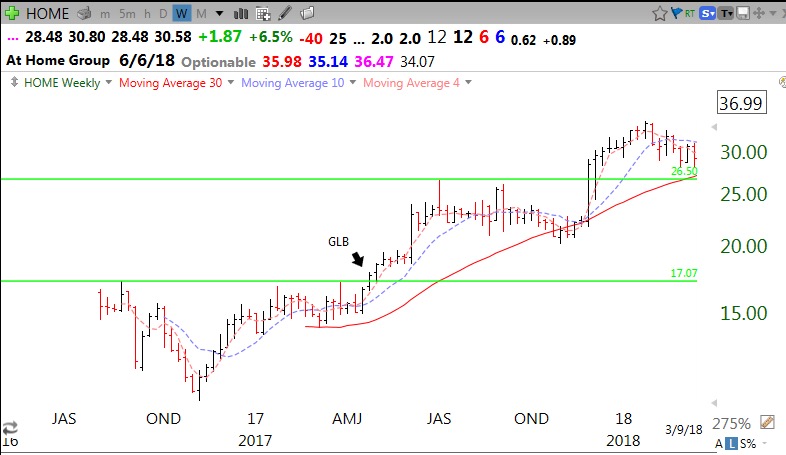
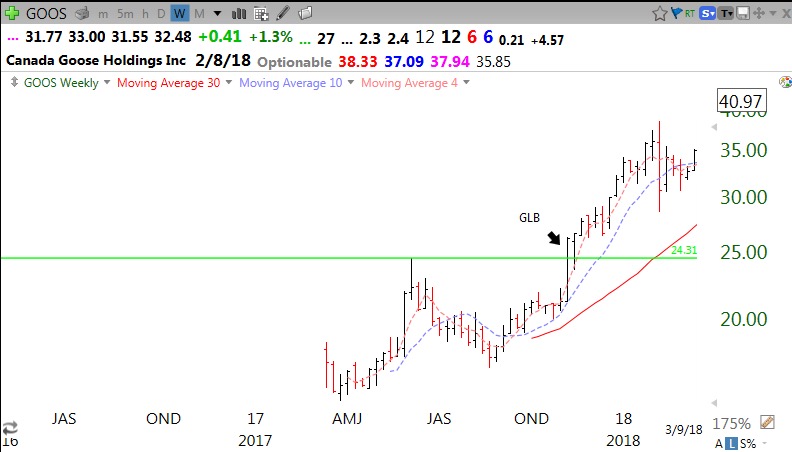
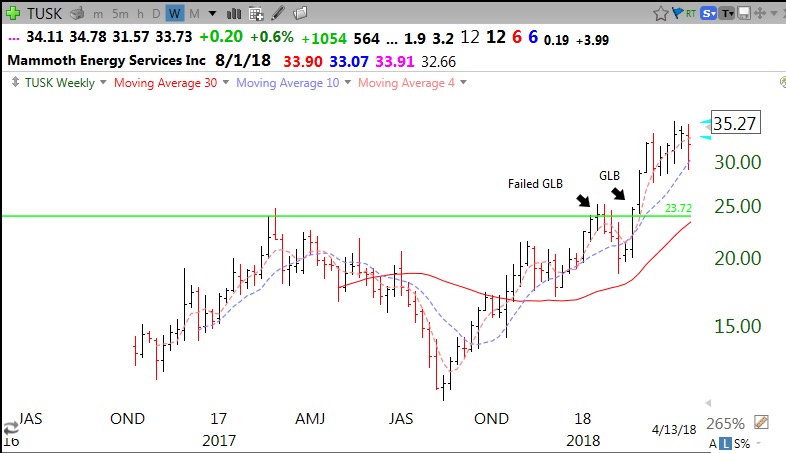
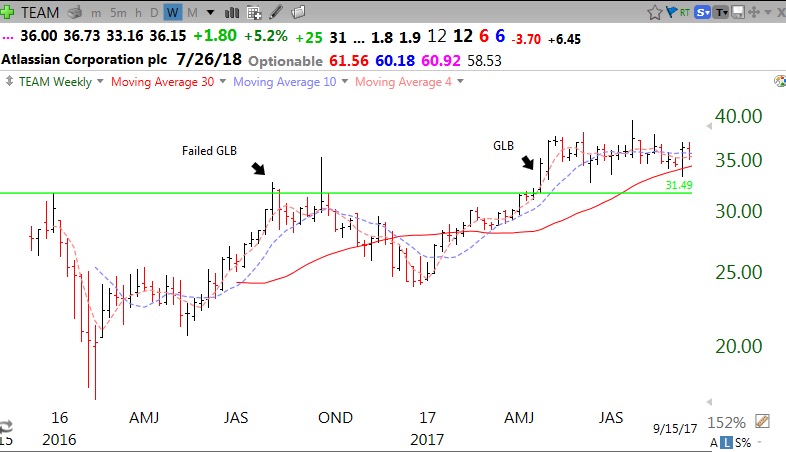
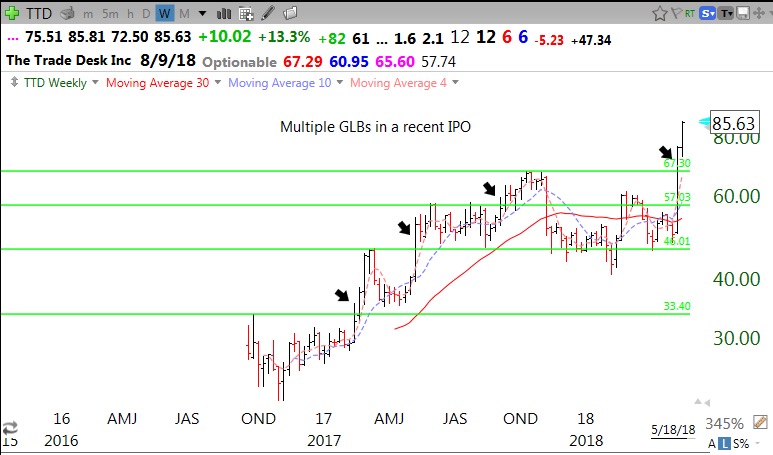
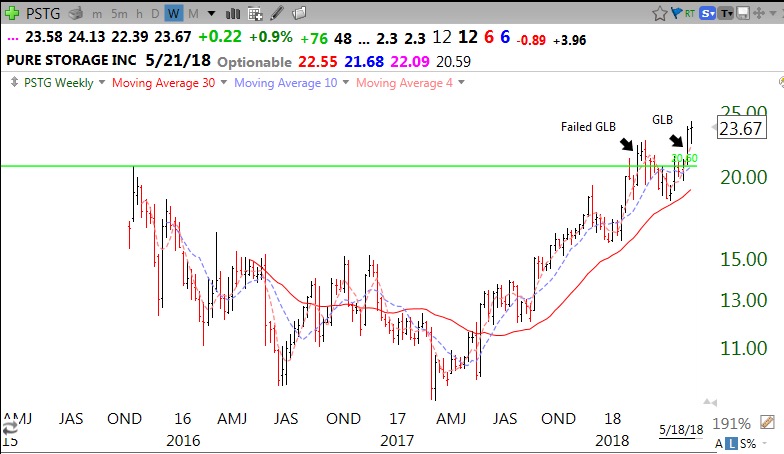
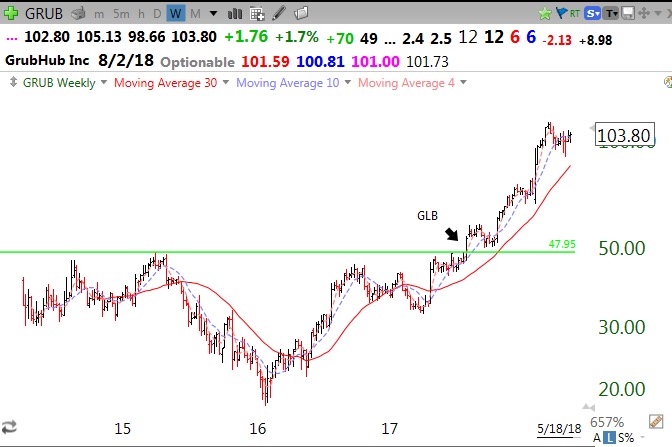
One more observation–if one is fortunate enough to hop on a successful GLB stock and pyramid one’s position, it might be a good strategy to stay aboard until it closes below its rising 30 week average (solid red line in charts). It takes patience and discipline; that is how fortunes can be made….
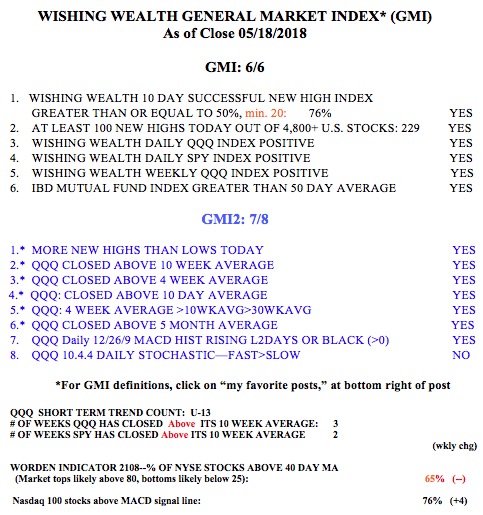
The GMI remains at 6 (of 6) and on a Green signal.