When markets decline I return to my modified Guppy GMMA charts to get a clear idea of the short and long term trends. I use a modified set of 12 exponential averages and one simple average (check out my blog glossary for details) to produce the pattern. Daily averages show shorter trends and weekly averages show more significant longer term trends. I draw a chart for each. In each timeframe, when the shorter averages (red lines) are above all of the longer averages (blue lines) with a white space between them, it is an RWB up-trend. Declines are the reverse, and show up as BWR down-trends.
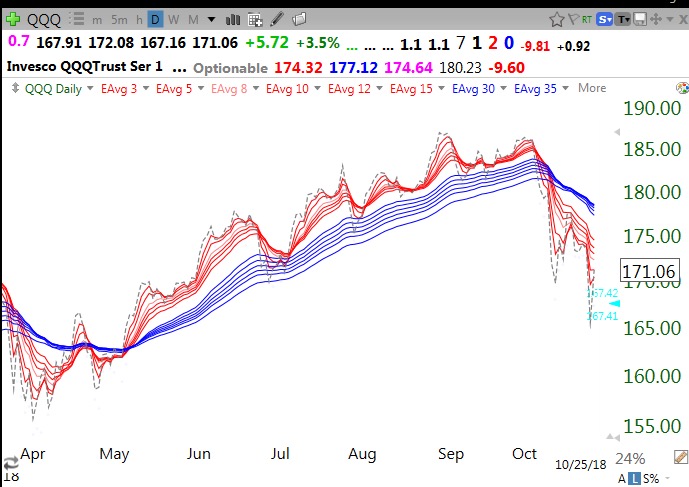
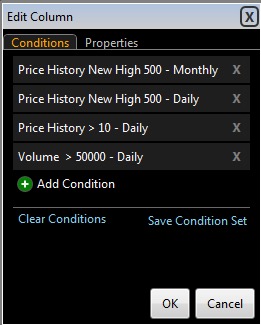
I created a column filter in TC2000 to detect equities with RWB up-trends on both their daily and weekly timeframes. I was startled to find that none of the 38 world ETFs I follow have both weekly and daily RWB up-trend patterns! Examples are shown below for the QQQ.
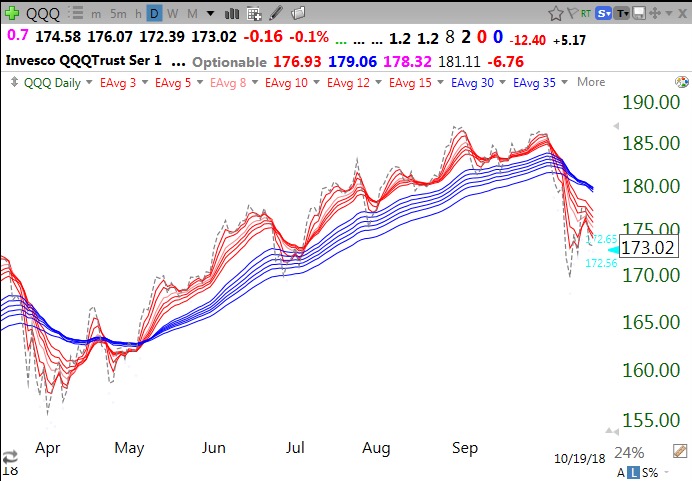
First the daily, showing a daily BWR downtrend:
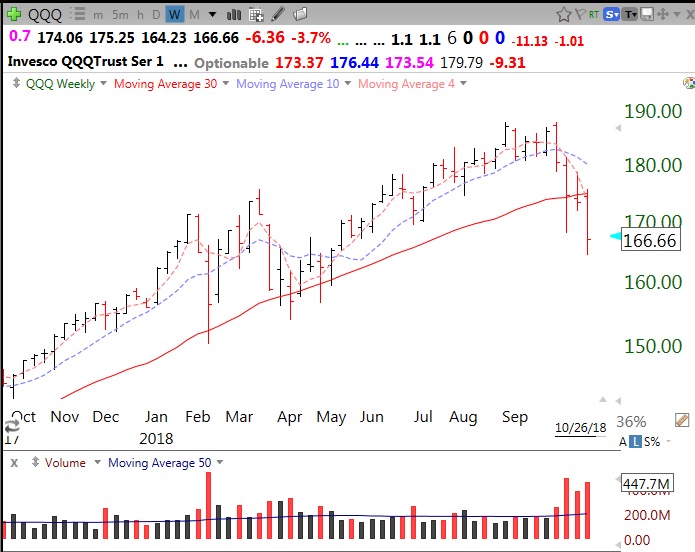
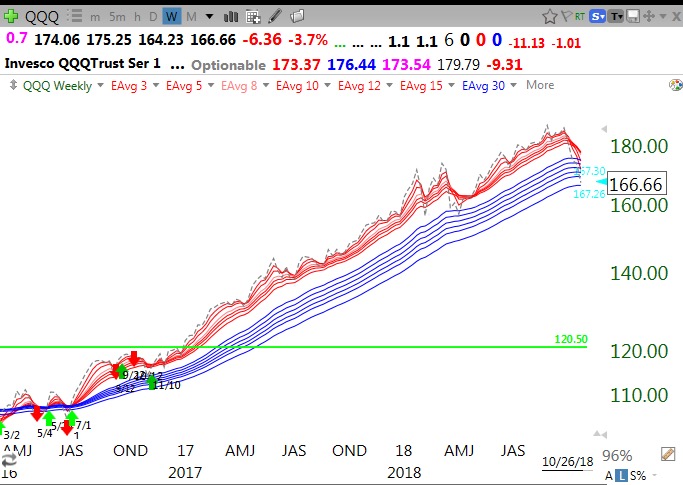
Now the weekly–the long RWB up-trend has ended, but a weekly BWR down-trend has not formed, yet. The dotted line is the close each period.
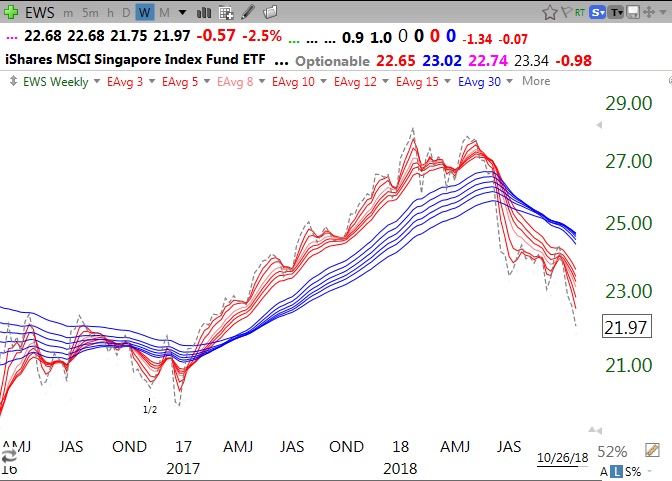
34 of the 38 country ETFs (89%) are in weekly BWR down-trends! For example, Singapore:
And China looks like a major double top!
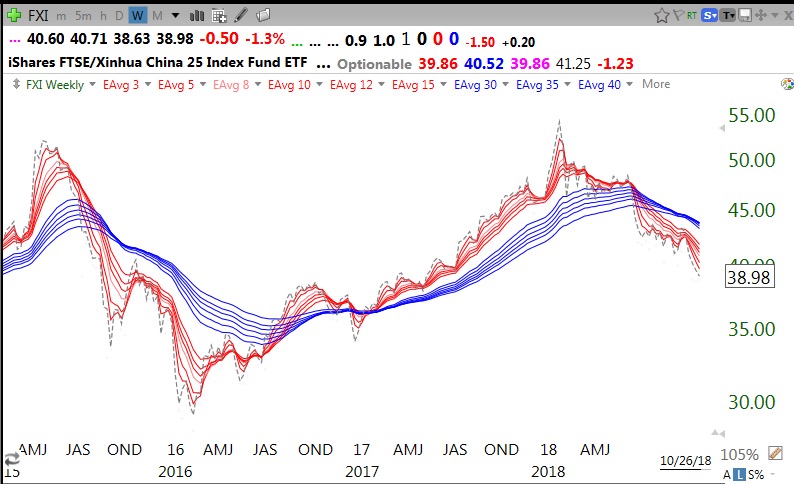
With most of the world markets in weekly BWR down-trends, it may be that the U.S. markets are just catching up to them, and may have a long way to fall…..
While I have been in cash during this decline (the GMI, once again, alerted me to get out), my students are learning to trade virtual margin accounts of $100,000 and must stay 90% invested. They are experiencing many losses while trying to go long growth stocks using the set-ups I have taught them. I did teach them that these set-ups only work in rising markets, and they are learning this valuable lesson. However, to help them go against the tide and find some up trending stocks to purchase, I ran my weekly and daily RWB filter to find stocks that are still in up-trends. I found that just 62 0f 4,938 stocks (1.3%) in the US database met my criteria. I next sorted these stocks by appreciation from a year ago and found that 16 of them are now up 80% or more from a year ago.
If, like my students, I had to buy stocks now, I would research these “Sweet 16”: ECYT REGI GHDX FRPT EHTH OFG NEO CORE UVE ARII XOXO REV SPNE SCWX SONC BURL. This filter might work much better when in a rising market!
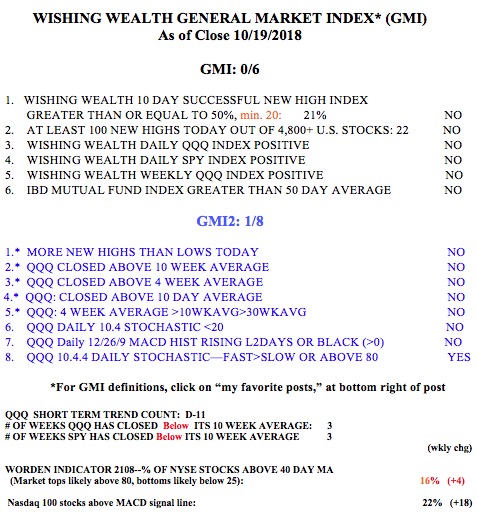
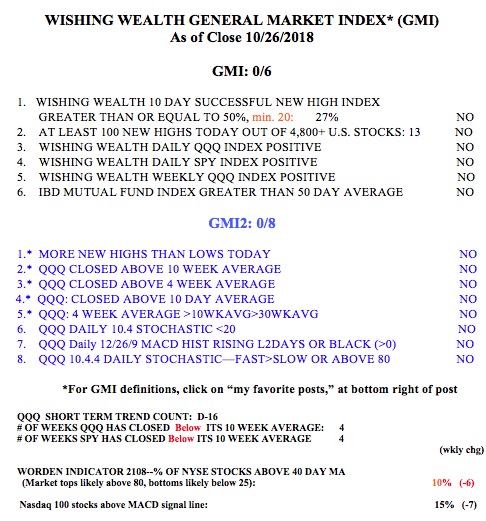
The GMI remains at 0 (of 6) and on a Red signal.
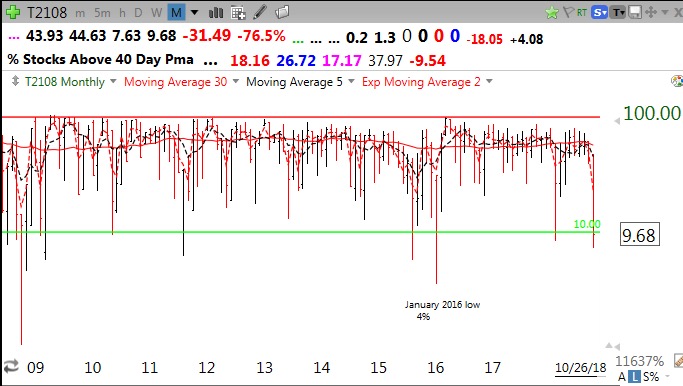
One sign that we could be close to a bottom is that the T2108 indicator closed Friday below 10%. This monthly chart shows how rare it has been for the T2108 to be below 10% since 2008 (shown by green line). T2108 did reach 4% in 2016 and 1% in 2008. From its inception in 1986 to 2007, T2108 had only 7 other declines that reached below 10%.
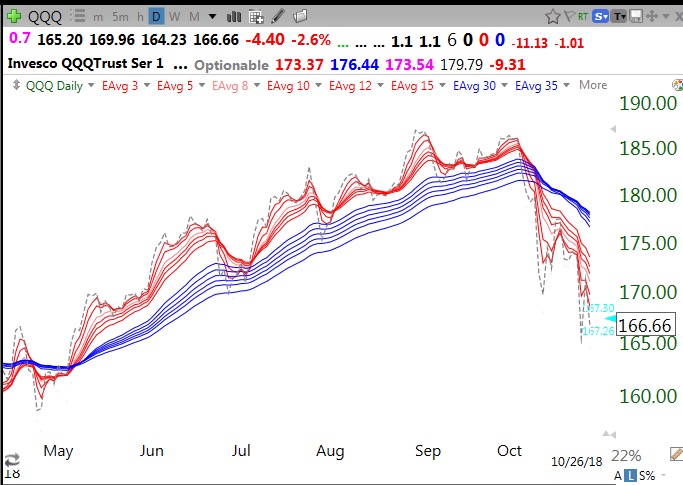
However, this weekly chart of the QQQ shows above average down volume the past 4 weeks and is an ominous technical sign. Most bear markets begin with the 30 week average (red line) curving down (Stage IV), which has not occurred. If it does, then this decline is just getting started…..