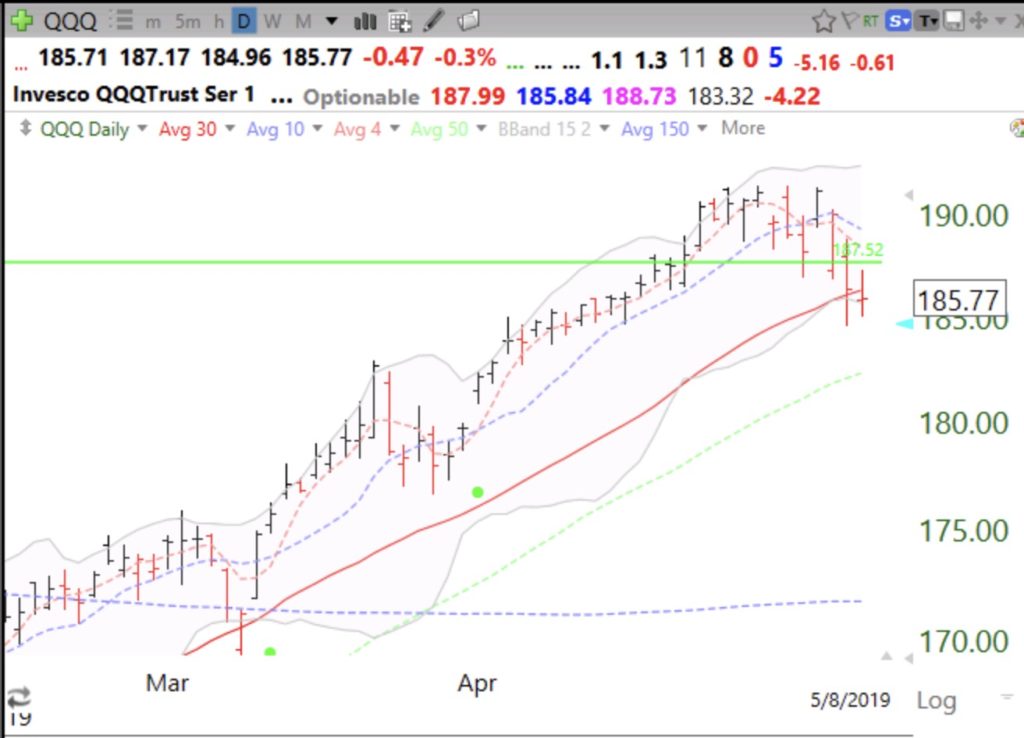
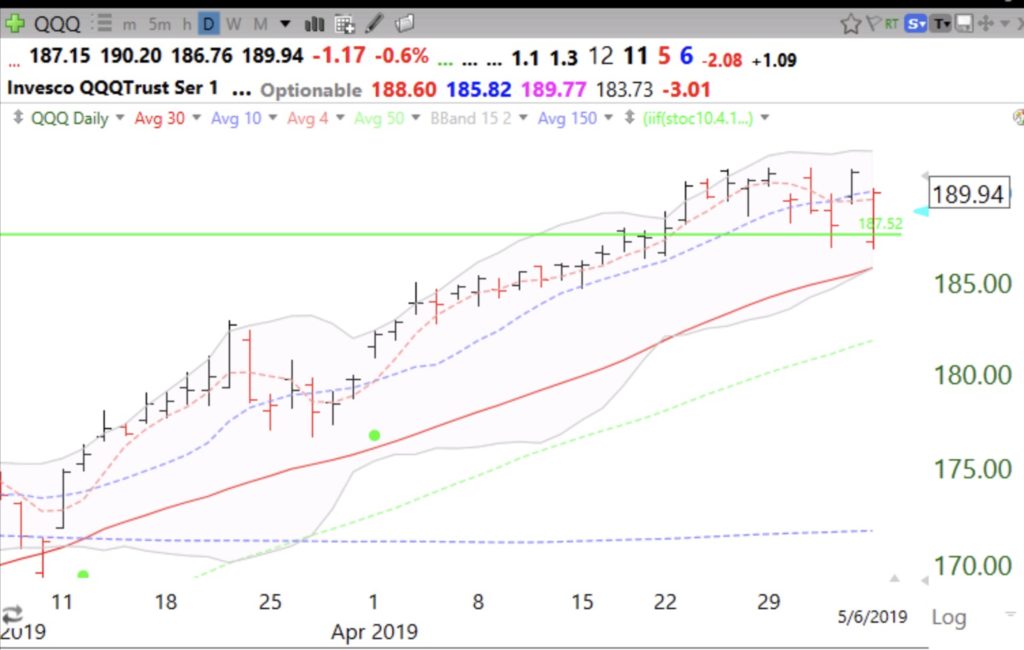
With a flat or down day on Thursday, the QQQ short term up-trend, in its 83rd day, will end. Since 1990, the longest short term up-trend has been 88 days. However, the end of an up-trend is not necessarily followed by a long down-trend. Stay tuned….
 Dr. Wish
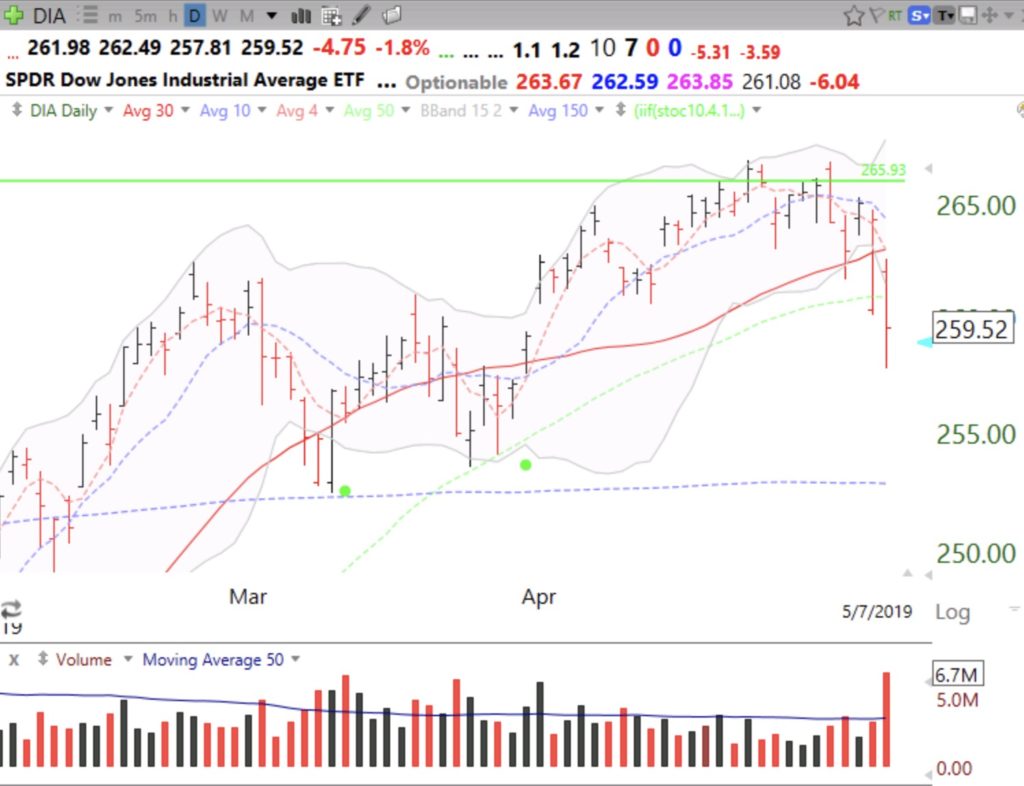
$DIA, $QQQ, $SPY have failed GLBs; GMI=3 (of 6)
The three index ETFs failed to hold their recent green line break-outs (GLB) to all-time highs. Failure of a GLB can be a serious sign of impending near term technical weakness. Tuesday was the 82nd day of the QQQ short term up-trend and is approaching the longest short term up-trend (88 days) since 1990. This fact, alone, suggested to me that we would experience some weakness. Tuesday’s high volume decline indicates an IBD type distribution day.


