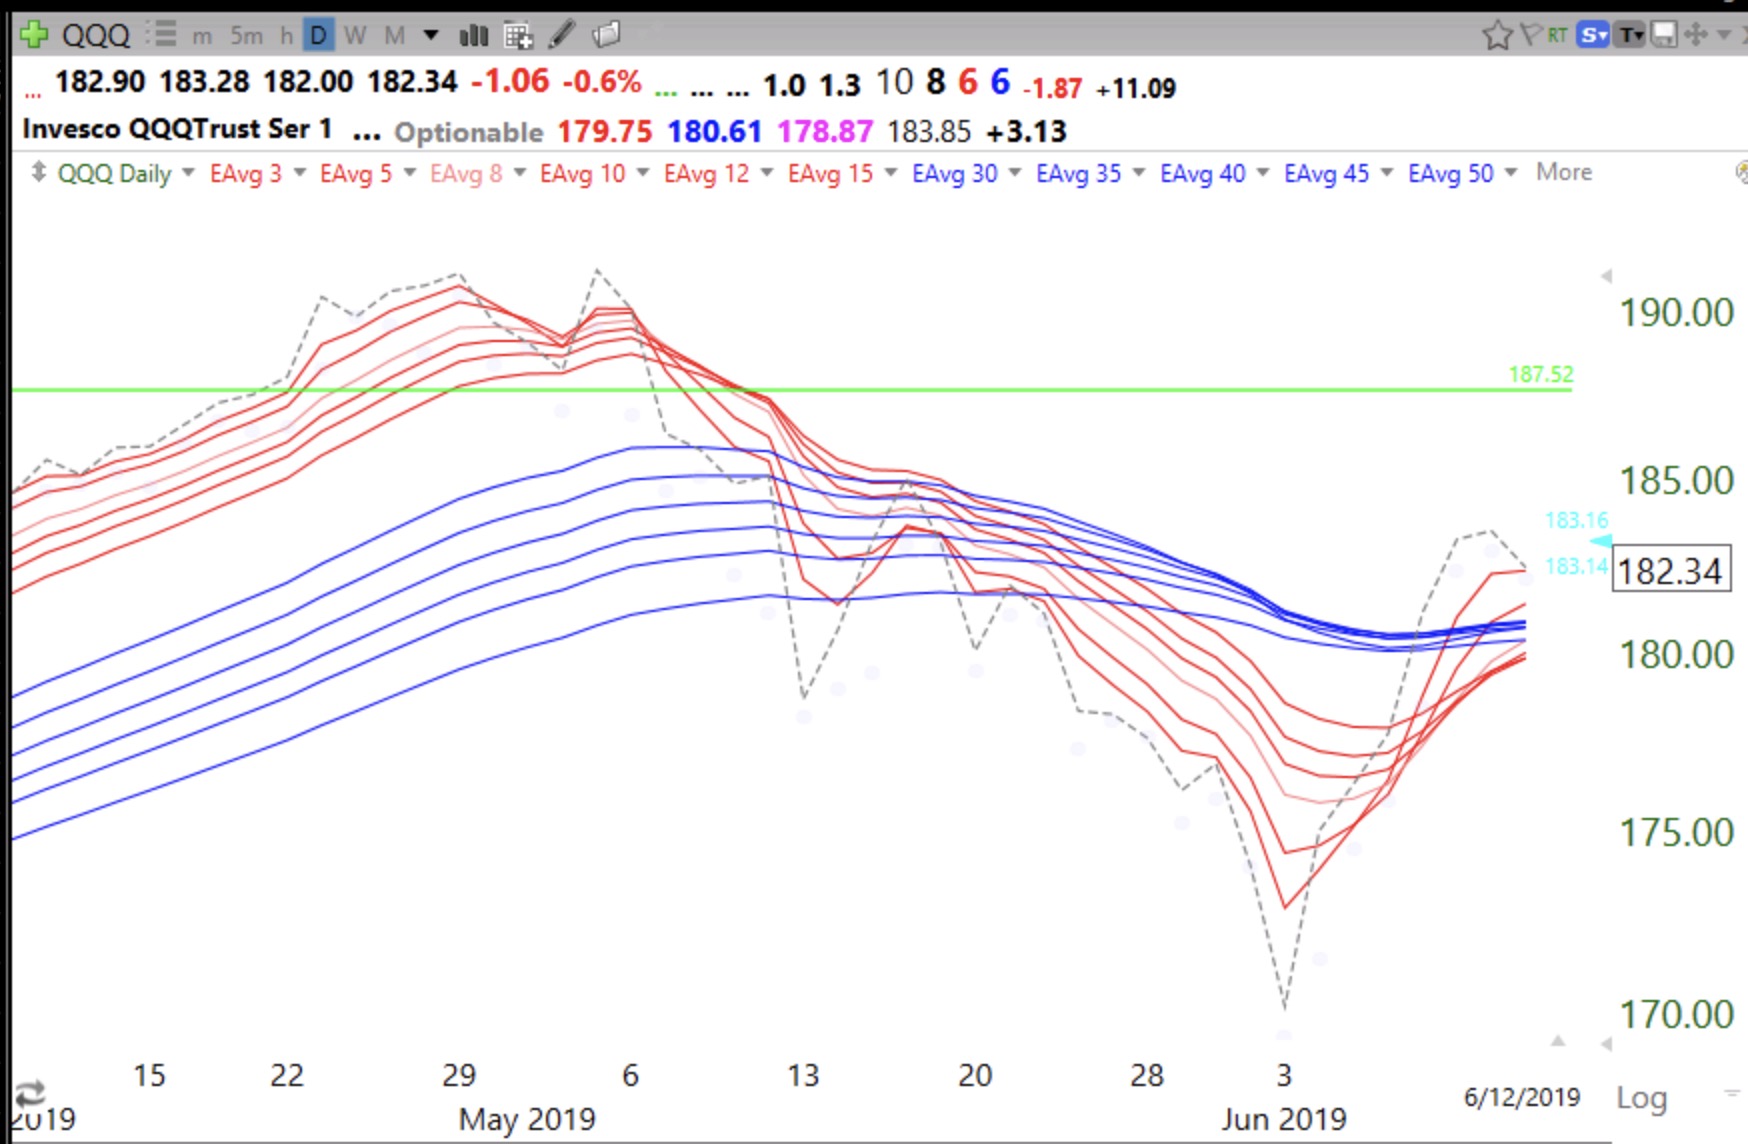
Daily BWR down-trend pattern is over but there is not yet a daily RWB pattern, The close of QQQ (dotted line) above all 12 moving averages is promising. Will it lead the averages up into a new RWB up-trend?
Stock Market Technical Indicators & Analysis
Daily BWR down-trend pattern is over but there is not yet a daily RWB pattern, The close of QQQ (dotted line) above all 12 moving averages is promising. Will it lead the averages up into a new RWB up-trend?
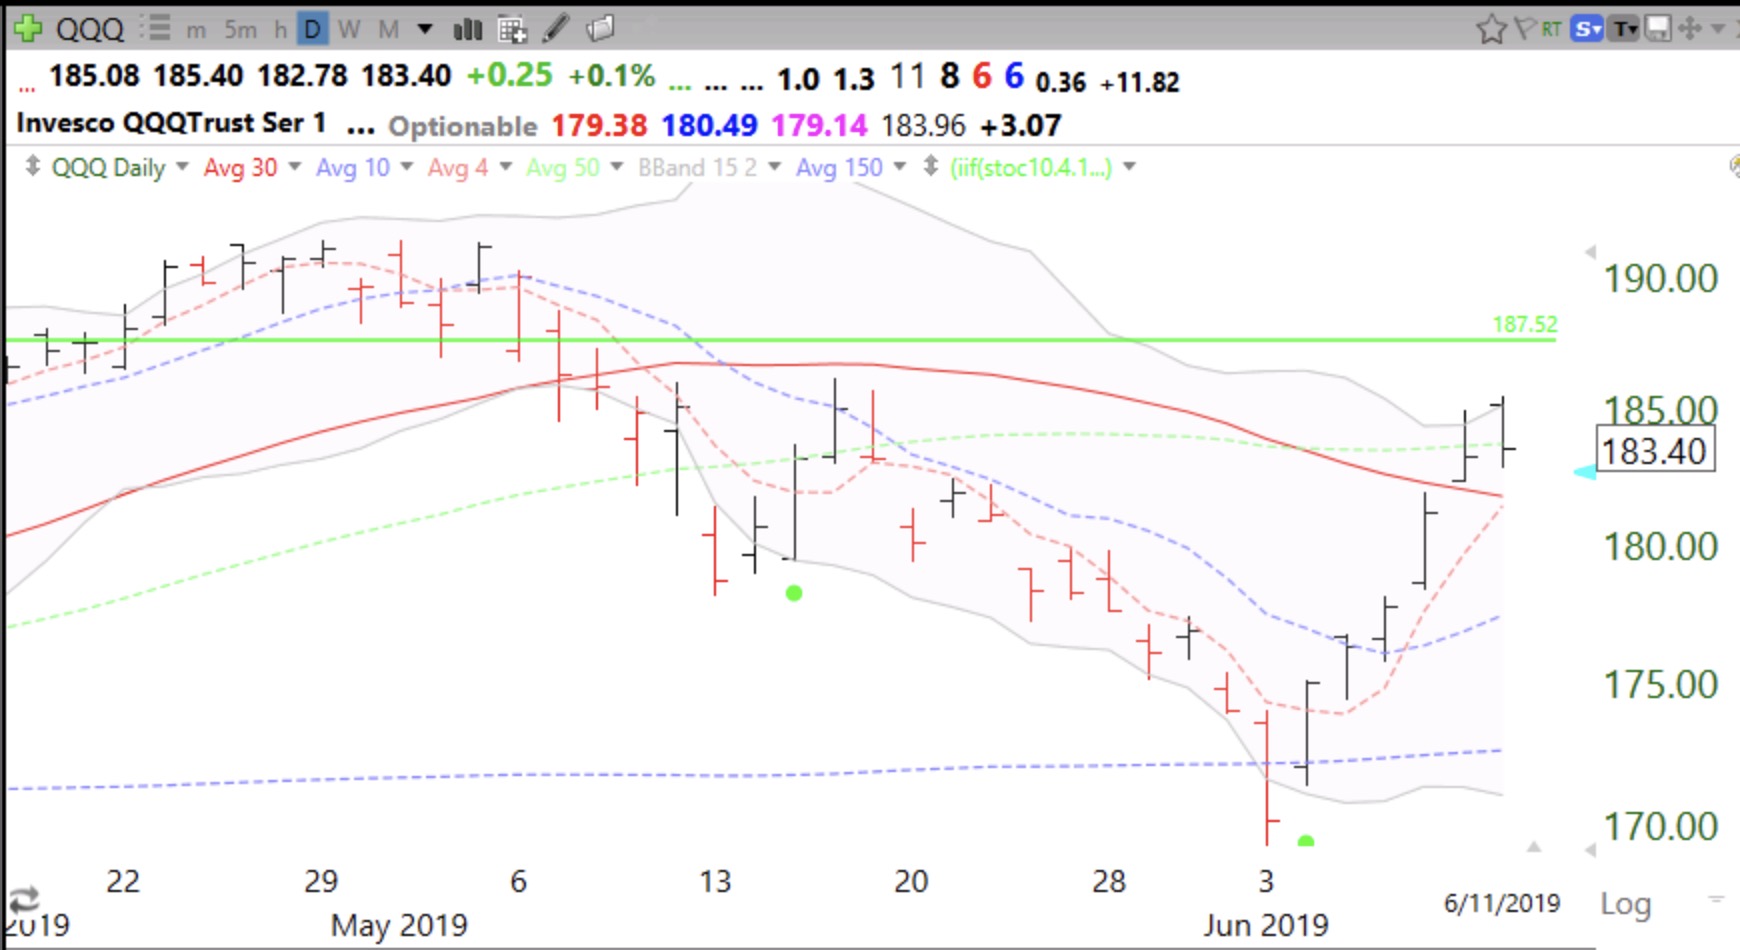
Only about 20% of new QQQ short term up-trends last less than 5 days. Nibbling at $TQQQ. Will accumulate as long as short term up-trend lasts and especially when it gets past 5 days.
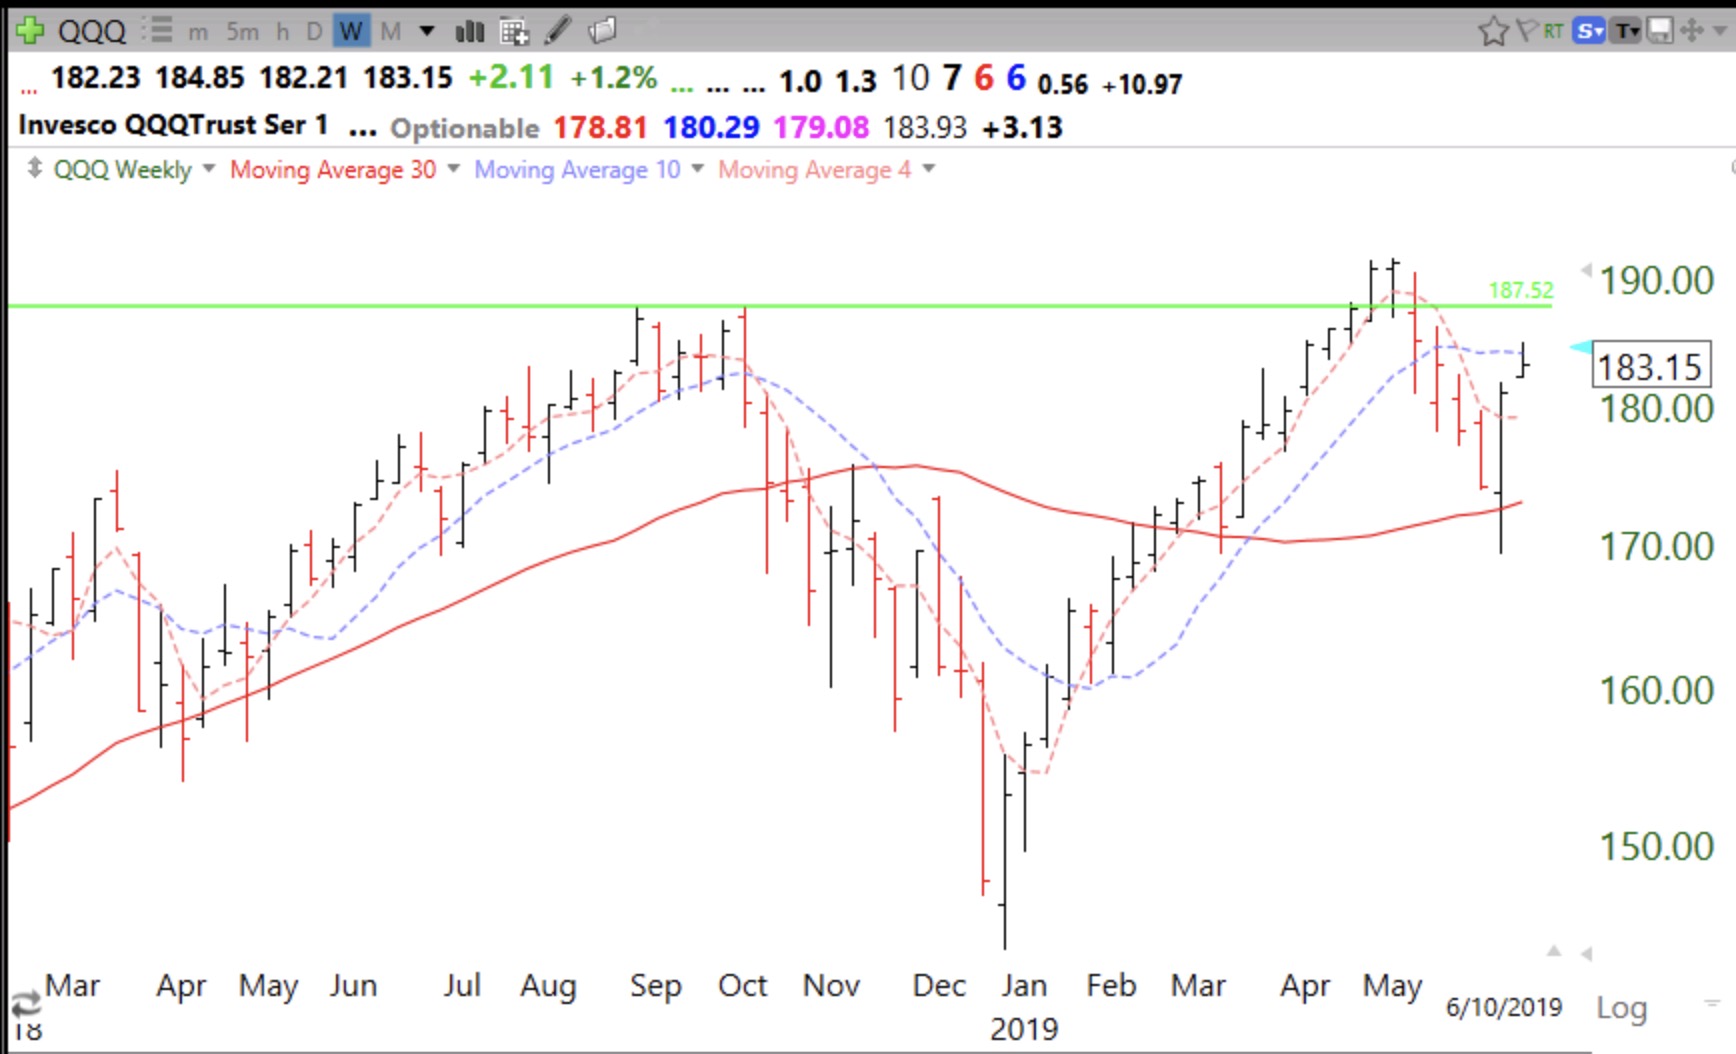
Time to look for long entries. However, patience is needed, the QQQ is extended, floating above its 4 week average (pink dotted line). Looking for a decline to that average or maybe a retest of the 30 week average.