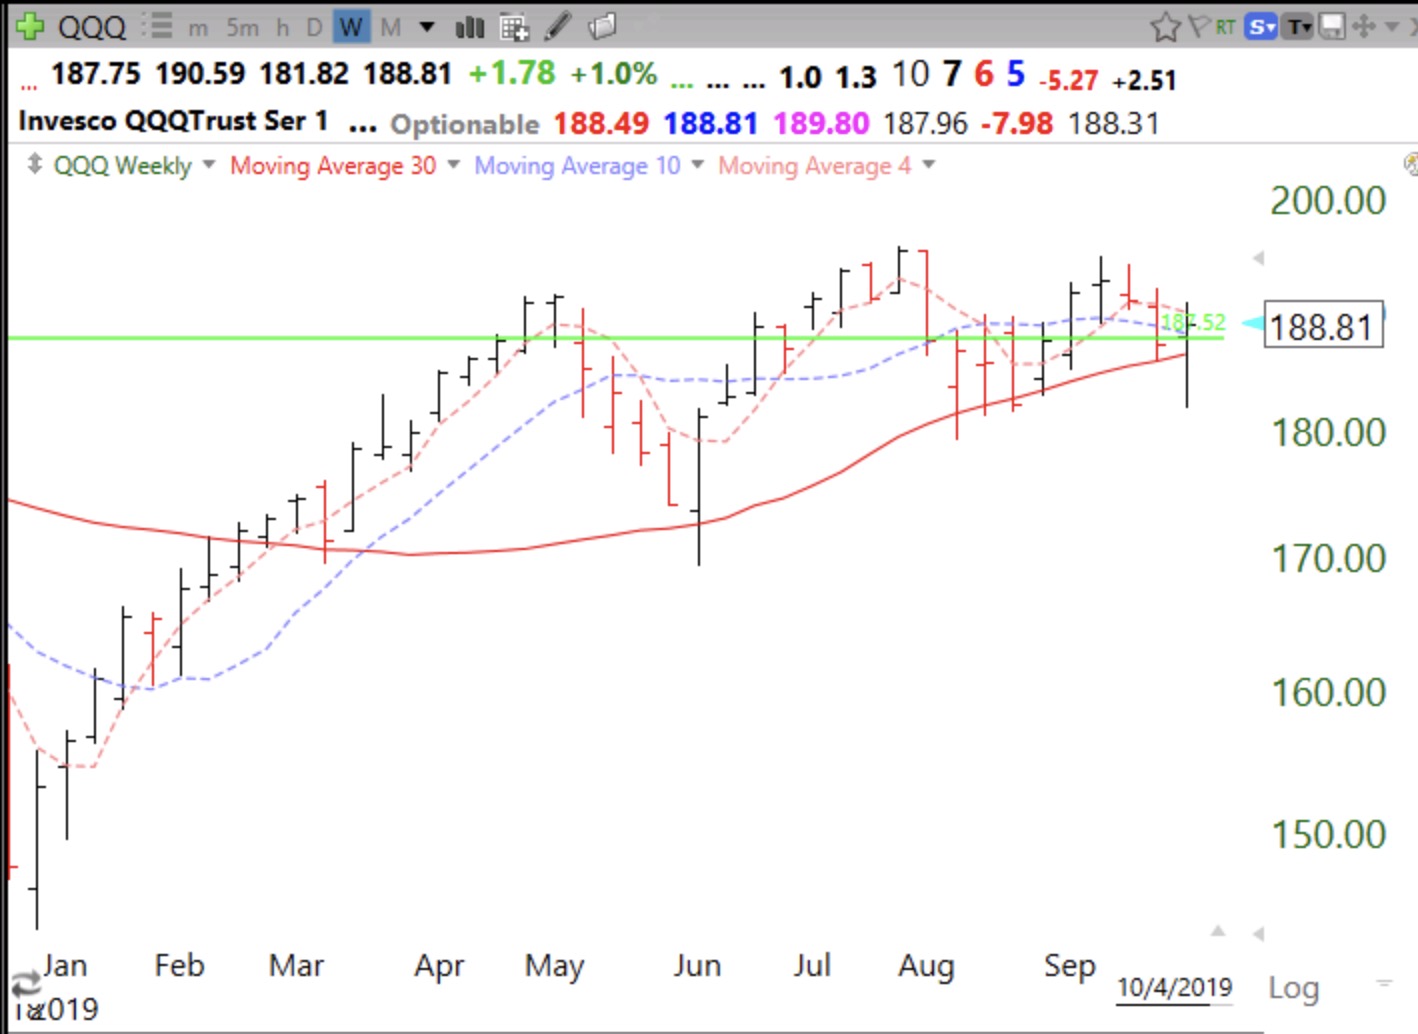
As long as the QQQ remains above its 30 week average (red line) and the average is climbing, the market is still in a longer term up-trend. If QQQ closes below its 30 week average for several weeks, we are in for a major decline. A close back above all-time highs would be very bullish.