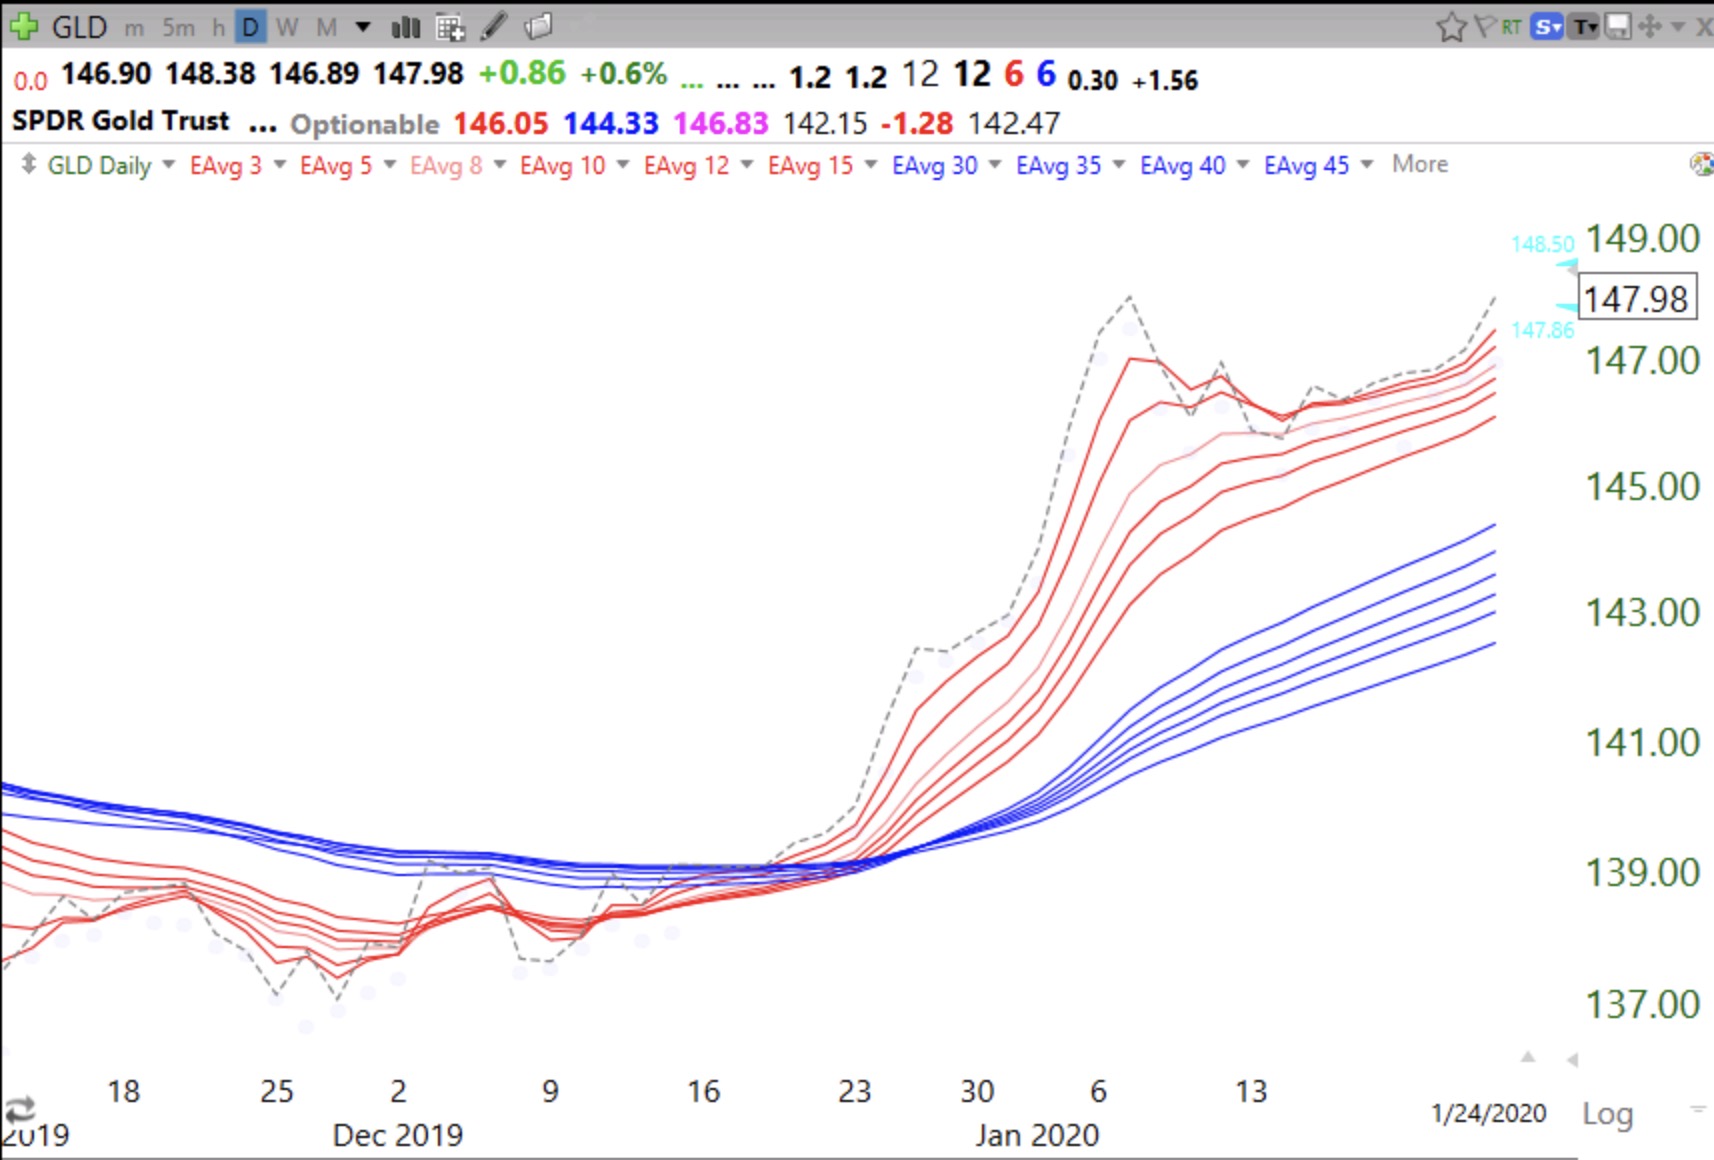
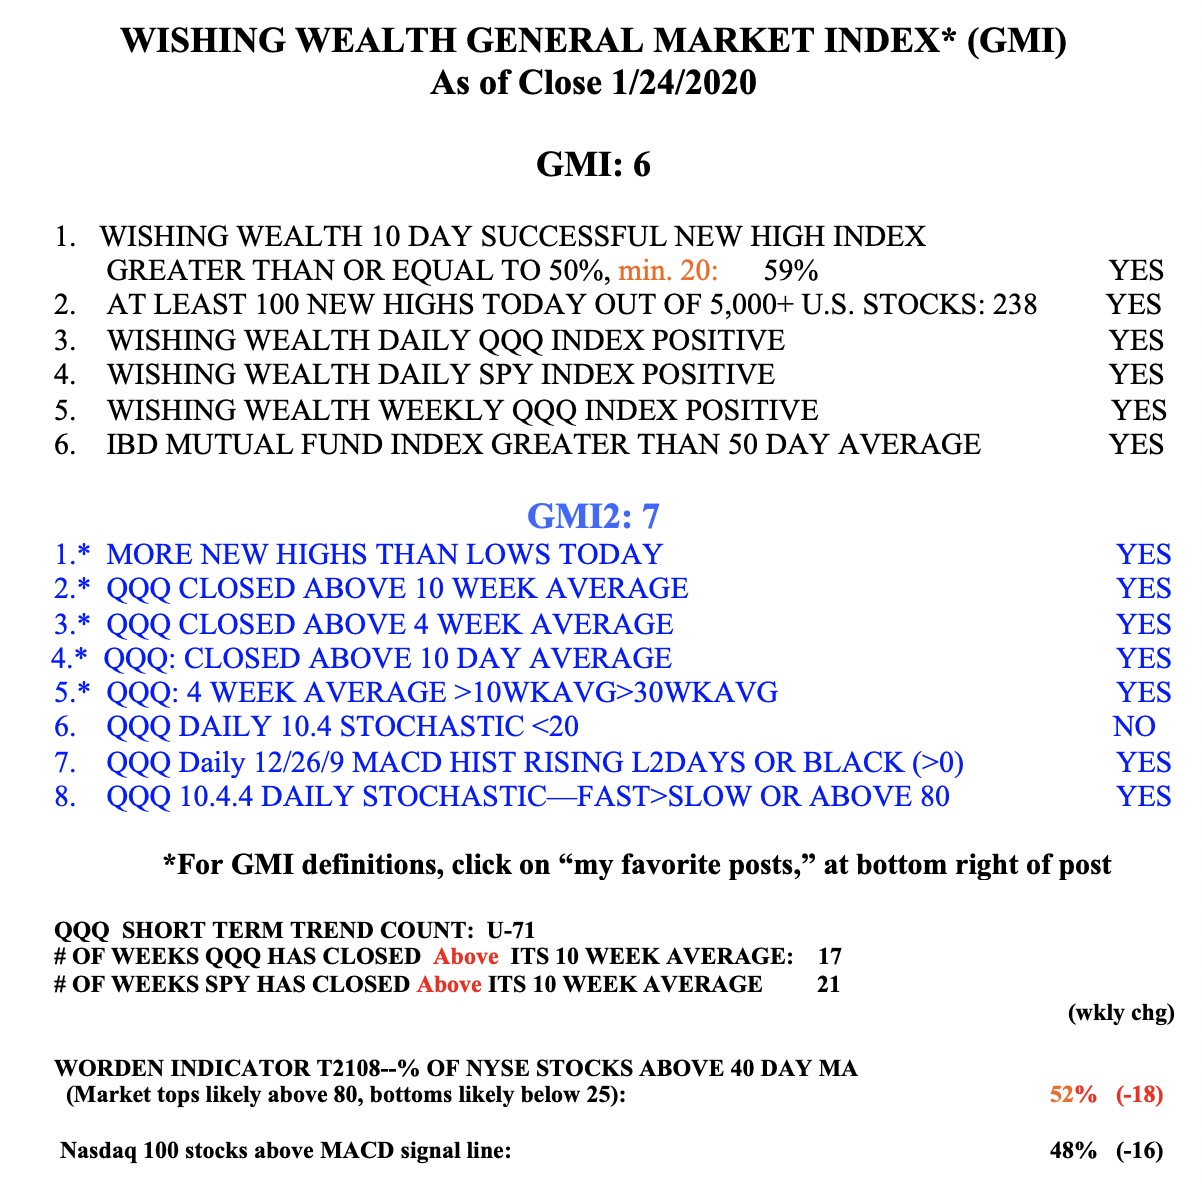
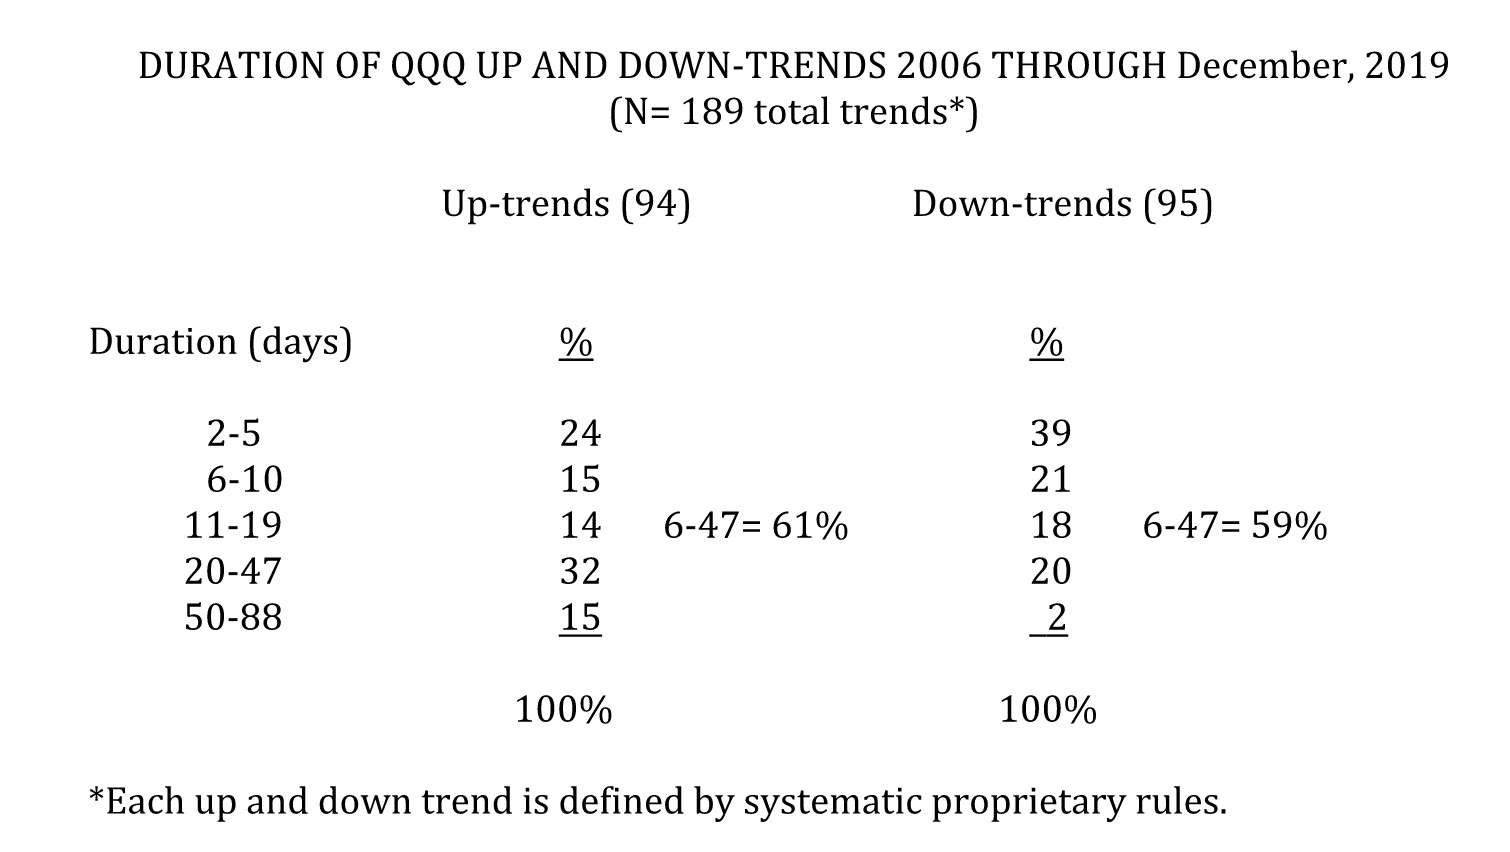
The market finally had a reason to go down, but the long term trends remain up (GMI table below). At 71 days, the QQQ short term up-trend is very old (see my previous post). We will have to wait to see whether the virus will trigger more selling. Meanwhile, I am very much hedged with GLD. Notice its recent green dot signal on this daily chart.
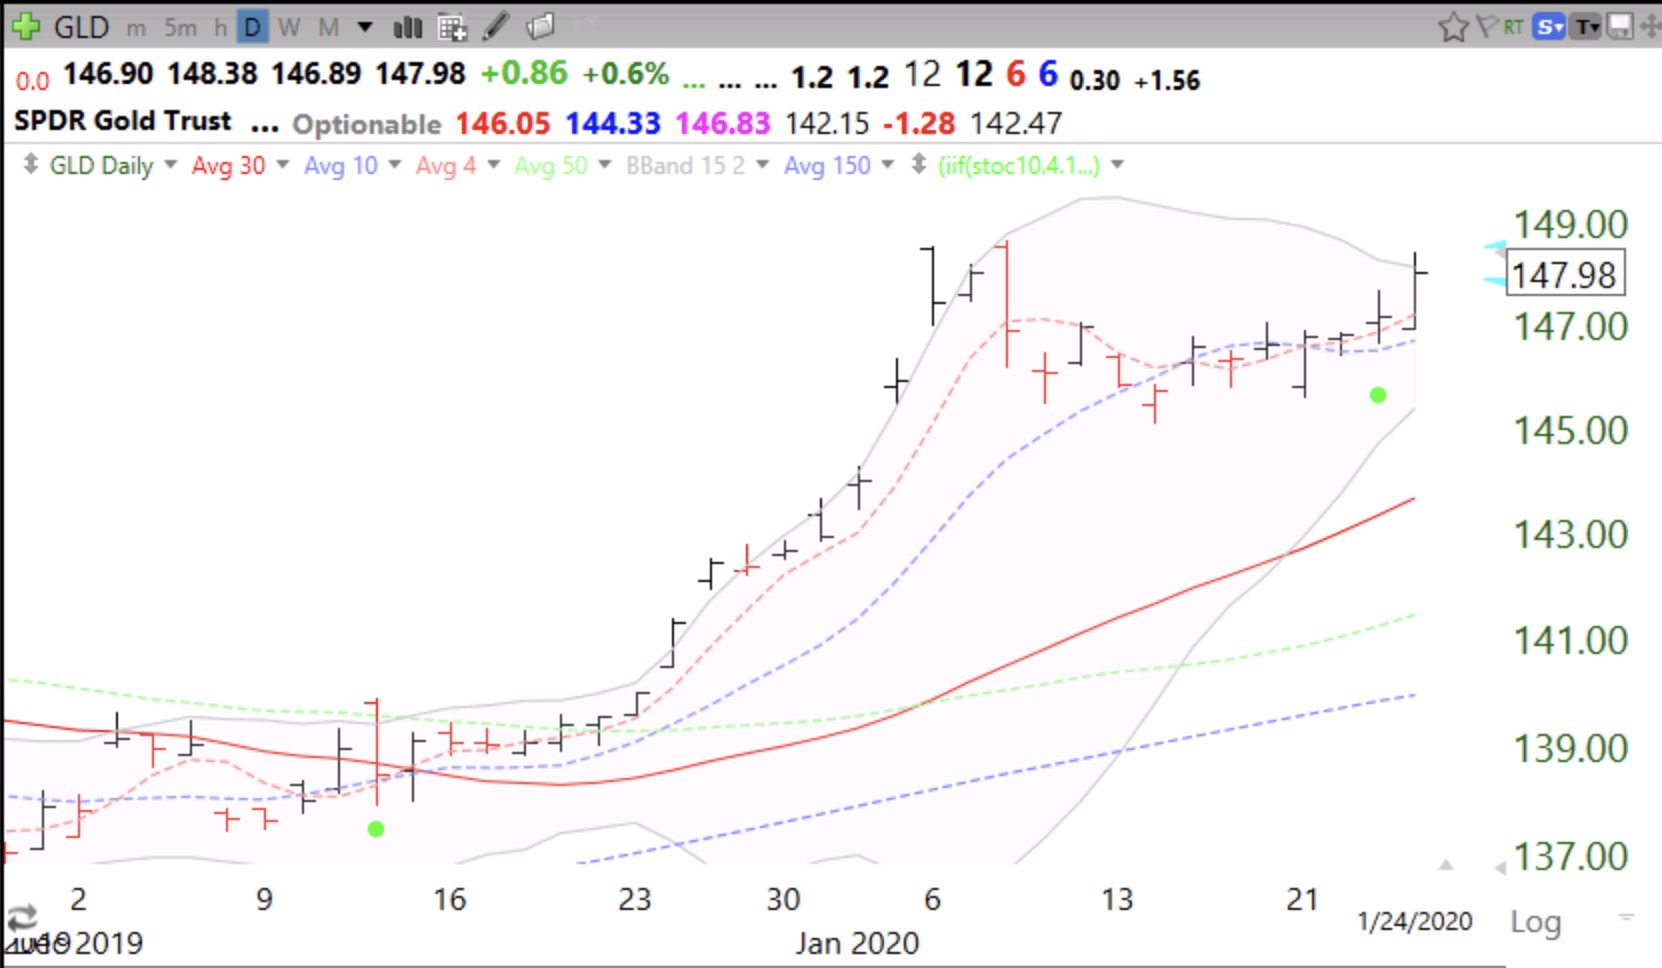
And GLD’s daily RWB up-trend pattern. I posted about this up-turn in December when I also bought call options on GLD.