 Dr. Wish
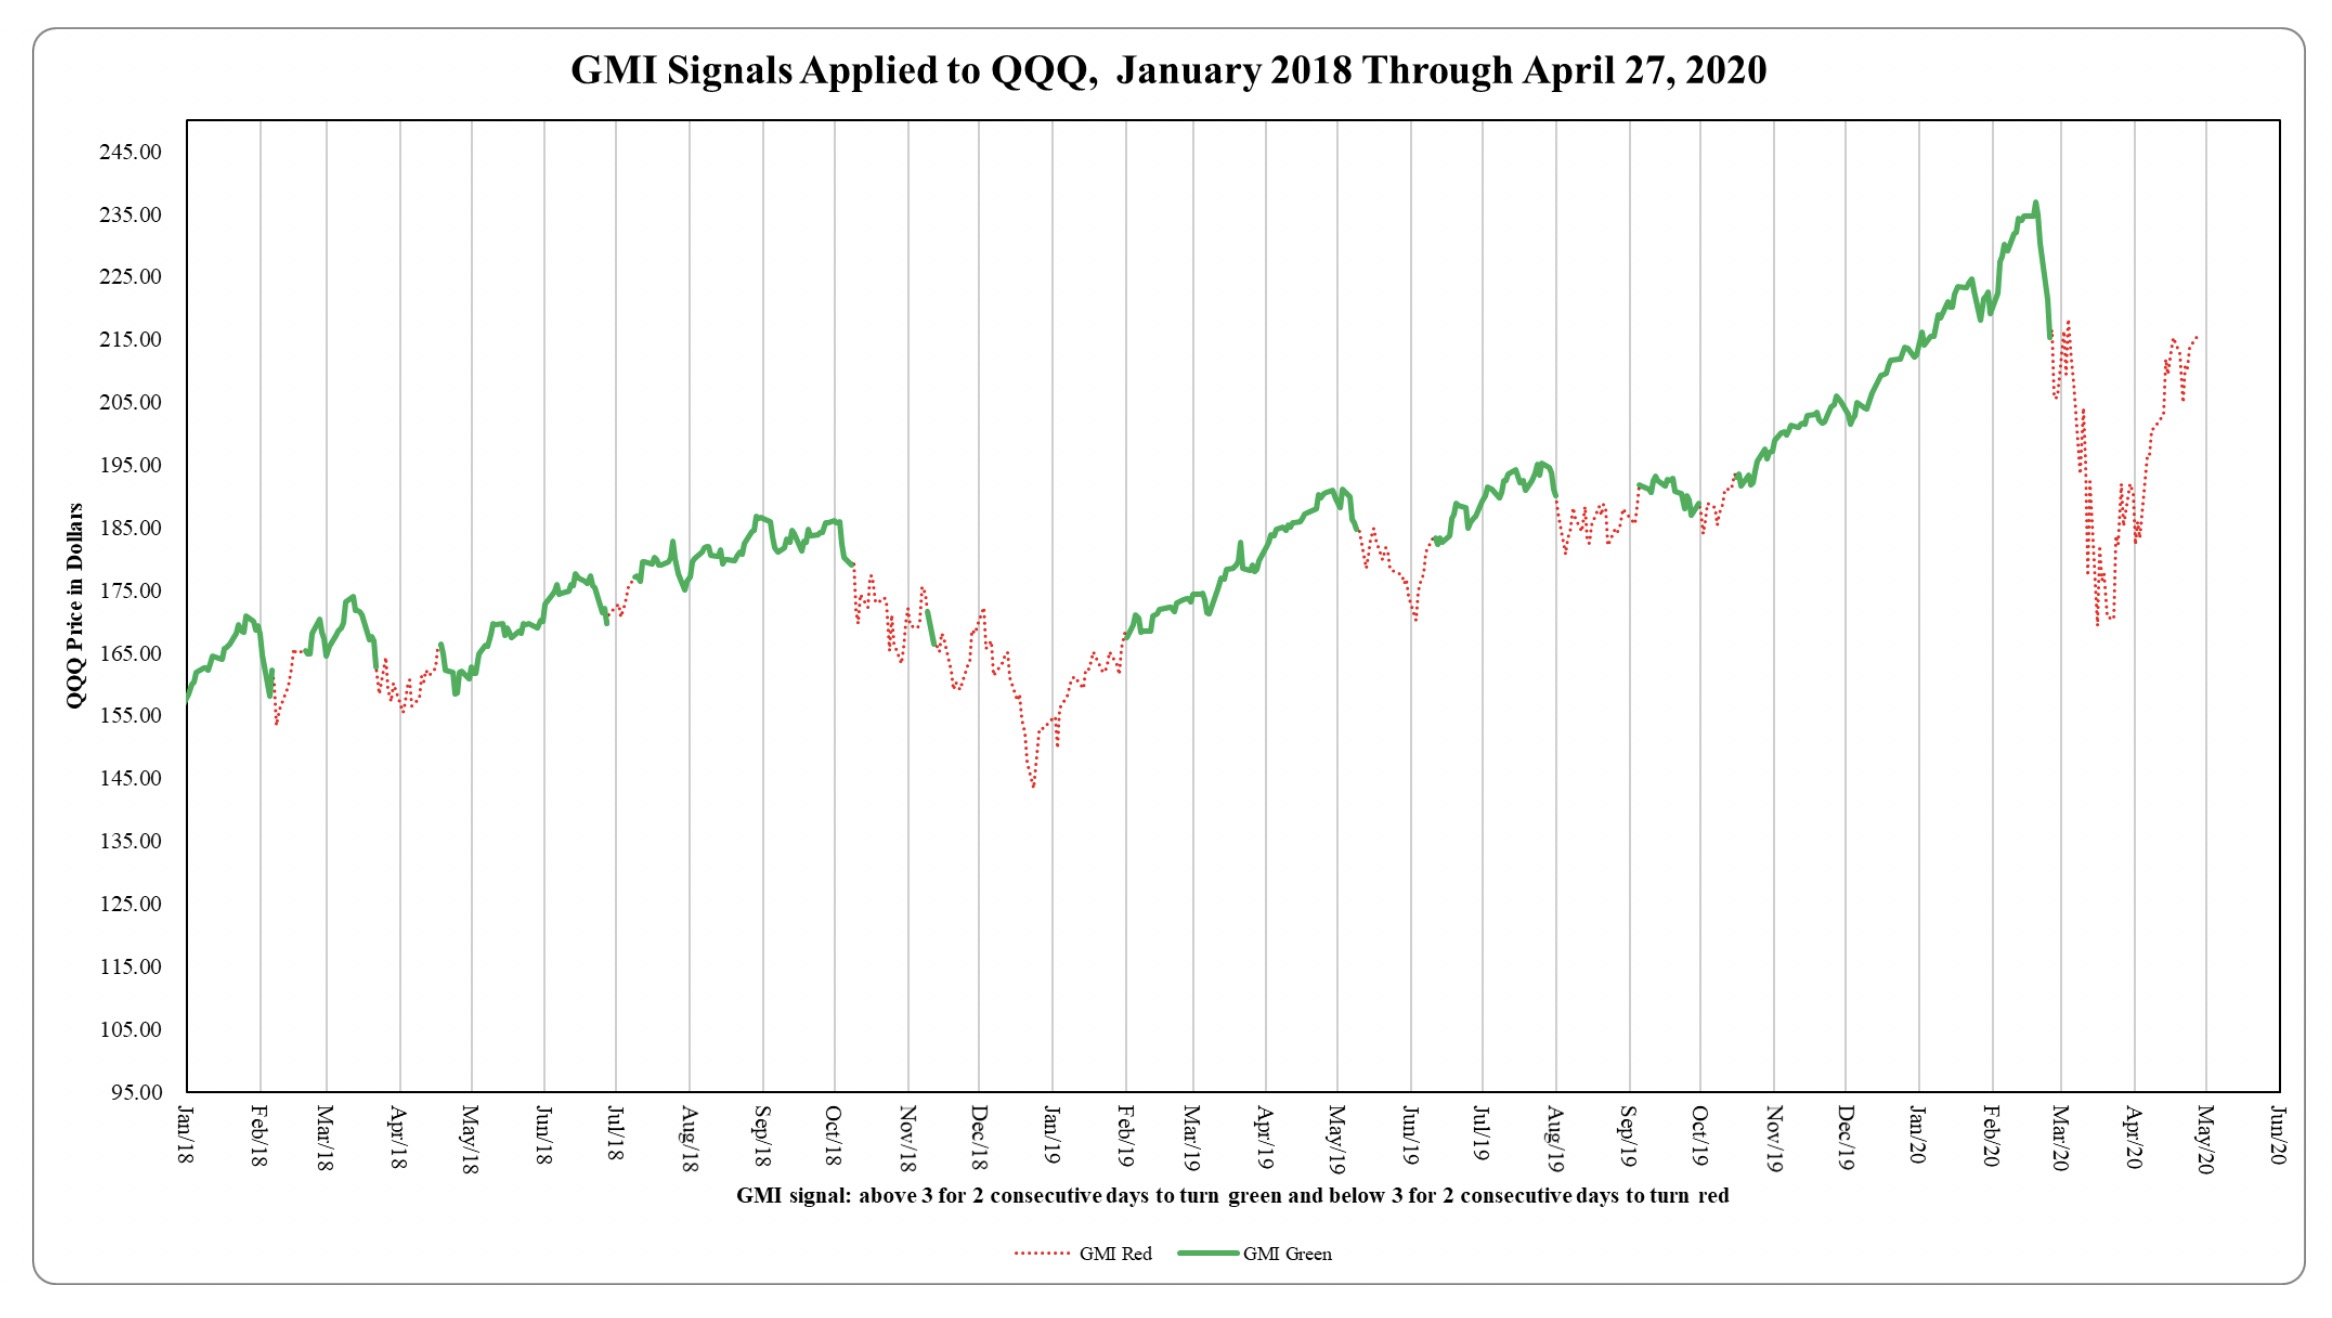
GMI could turn Green on Monday; invaluable tweets:@markminervini, @dryan310, @IBD_Irusha, @TMLtrader, my extraordinary student @RichardMoglen, and market author John Boik @monsterstocks1
I get a lot of value out of monitoring the tweets of the persons mentioned in my title today.
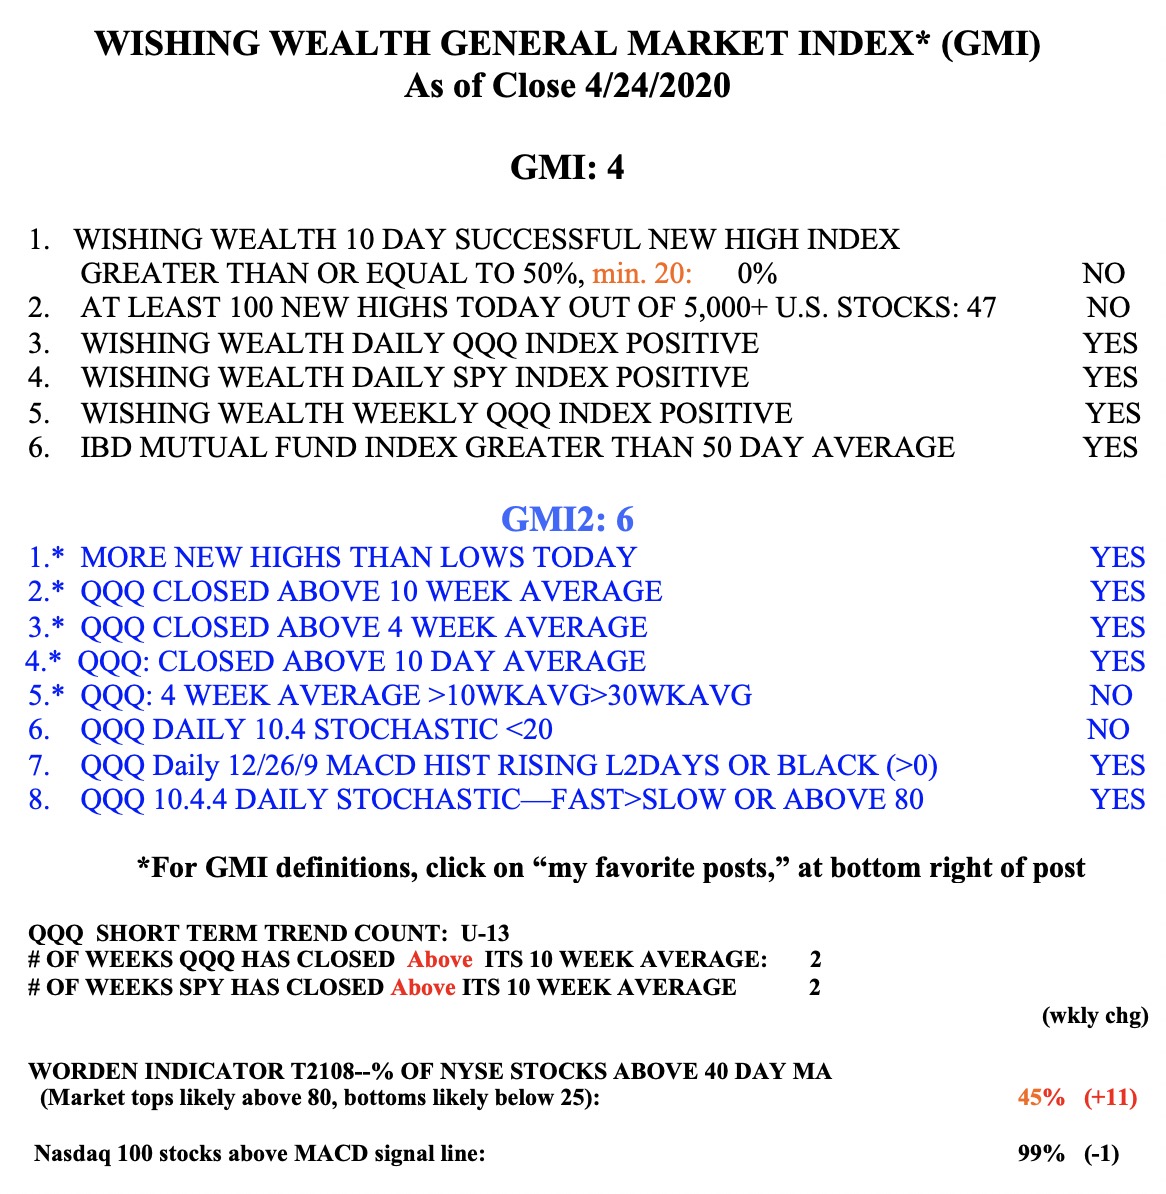
All we need is another day above 3 for the GMI to turn Green. The GMI usually gets me out of the market quicker than it gets me back in. Note that the 2 components that are still negative have to do with yearly highs. There were only 47 on Friday and not enough successful 10 day highs. Thus strategies that buy stocks at new highs may have an up hill battle.