In the past I have exited stocks when the major indexes had appeared to be entering Weinstein Stage IV down-trends. This I would determine when a major index, usually QQQ, had a declining 30 week moving average. A declining 30 week moving average occurs when the latest week’s price being added to the average is less than the 31st week being dropped. In other words, the current week’s closing price is less than its closing price 31 weeks ago, a serous sign of weakness. This is not the case now. The 30 week averages for the primary index ETFs are still rising. So what is troubling me?
The SPY and QQQ are capitalization weighted indexes, That means rather than just averaging all of the current prices for each stock in the index, they average the capitalization for each stock (total outstanding shares x price). This means that the few huge cap stocks like AAPL, MSFT etc. account for most of the movement in the index. The Dow 30 index (DIA) is price weighted so it averages each stock’s price (weighed for splits and changes in the component stocks) and the few large cap stocks have less influence on the result. Note that the DIA is not at all time highs while the QQQ and SPY are.
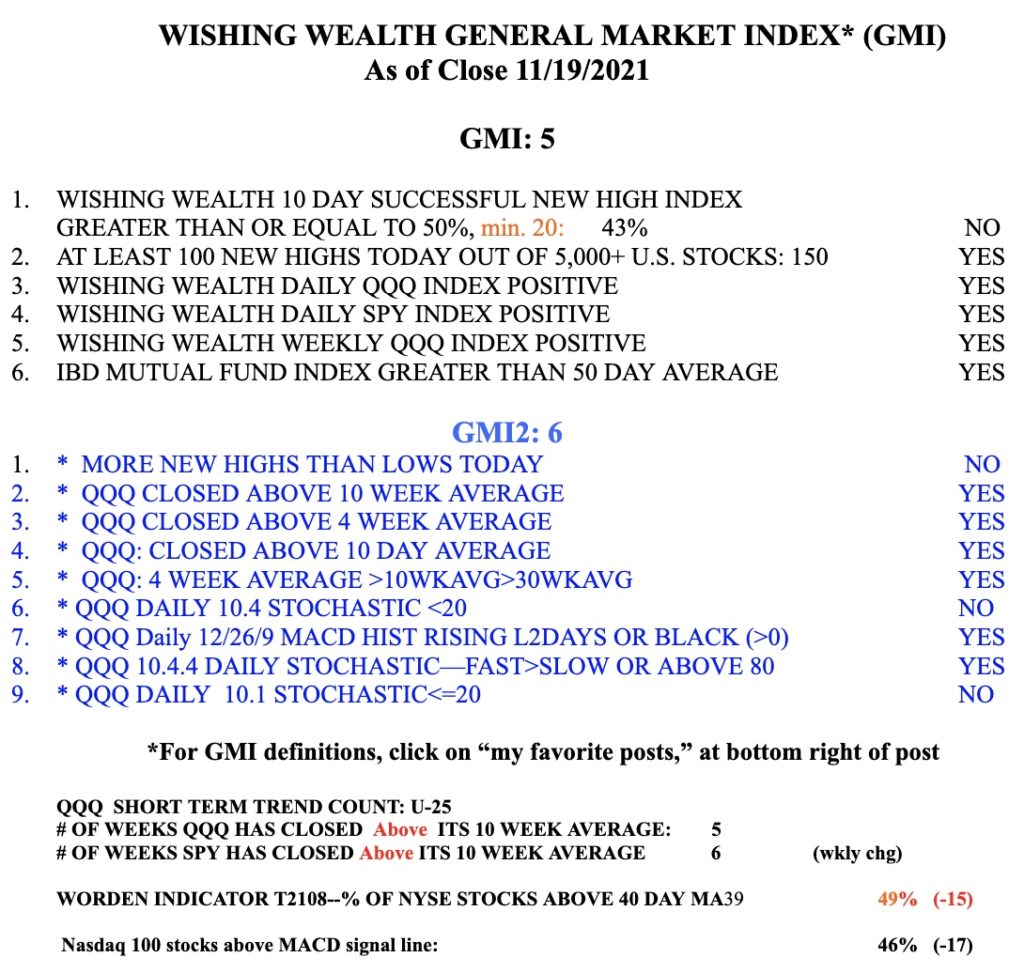
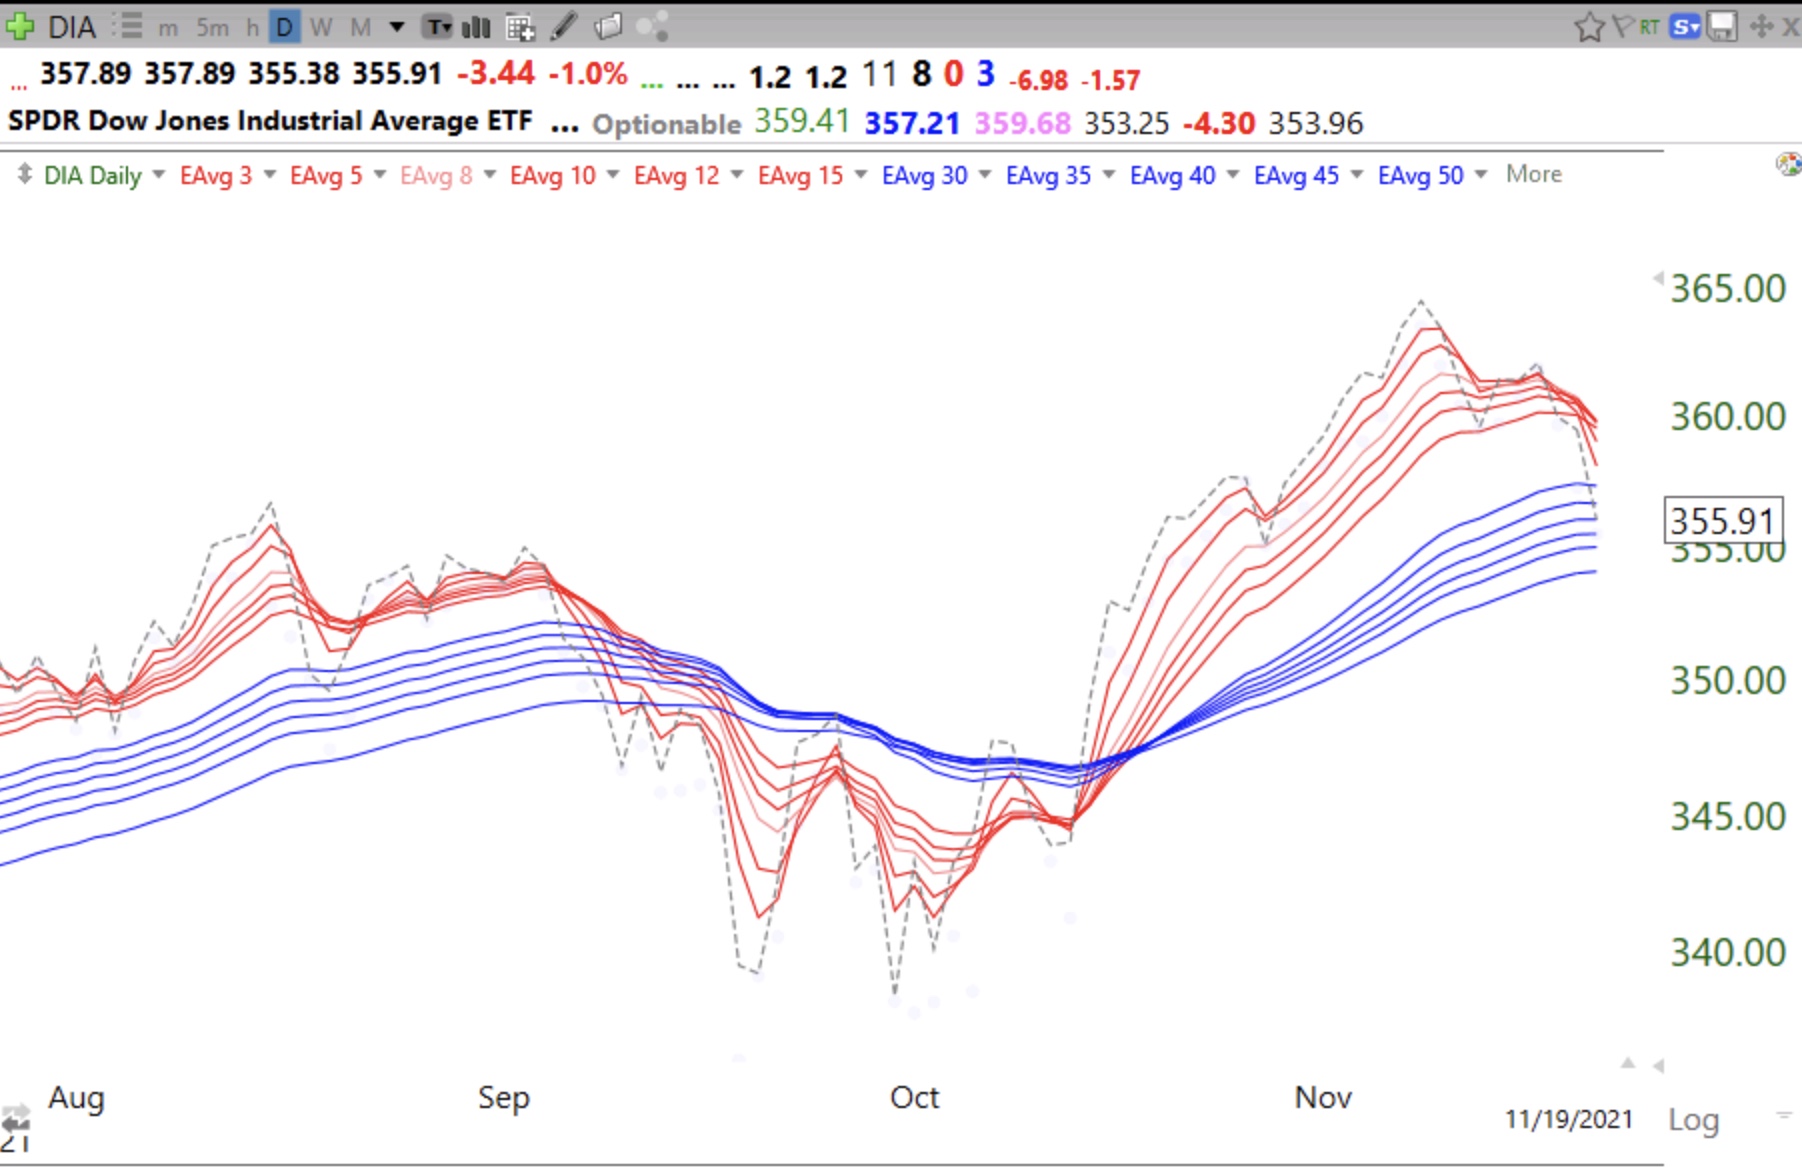
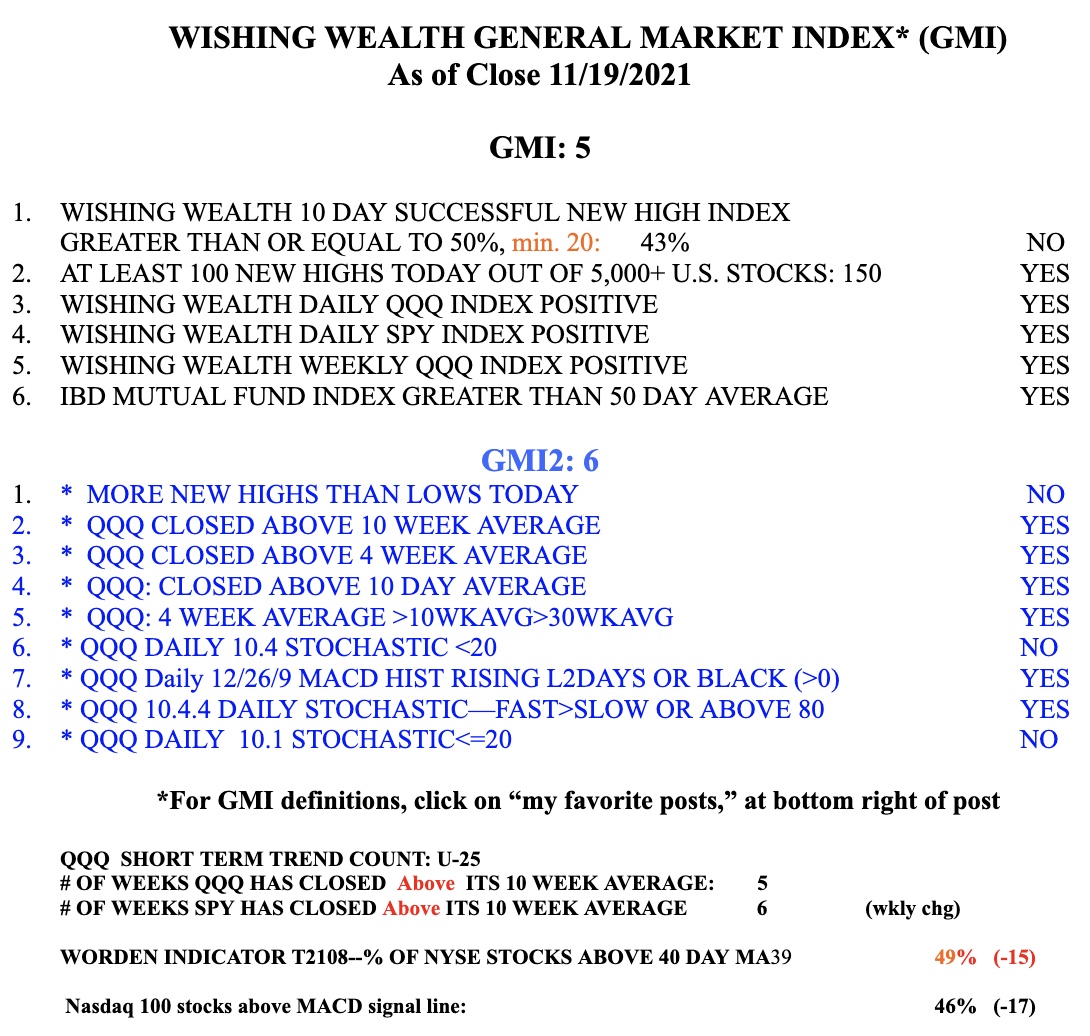
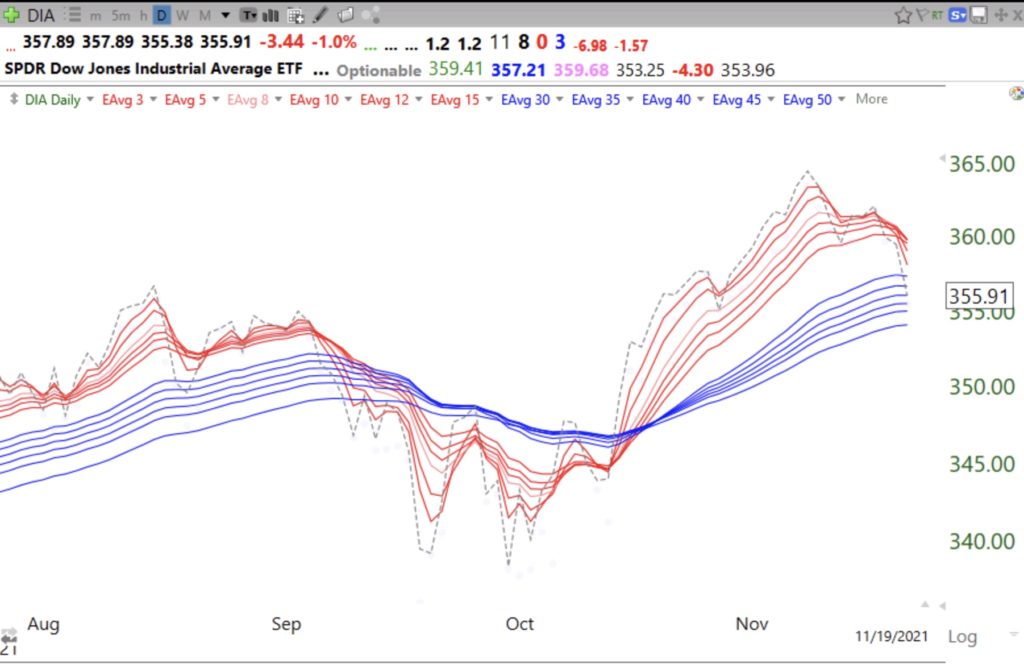
All of this means that the strength in the few very popular huge cap stocks are causing SPY and QQQ to not reflect the decline in most of their component stocks. On Friday, a day when SPY and QQQ hit all-time highs, there were 150 new highs and 305 new lows among US stocks. For the past 3 days there were more new lows than highs. In the past 3 days the chances that a stock that reached a new low 10 days ago was currently trading lower than 10 days earlier was 62%-78%. This was substantially lower than the likelihood that a stock at a new high 10 days ago closed higher than it had 10 days earlier, 43%-53%, see GMI chart below. The daily RWB pattern for IWM and DIA is actually in danger of ending. See DIA below.
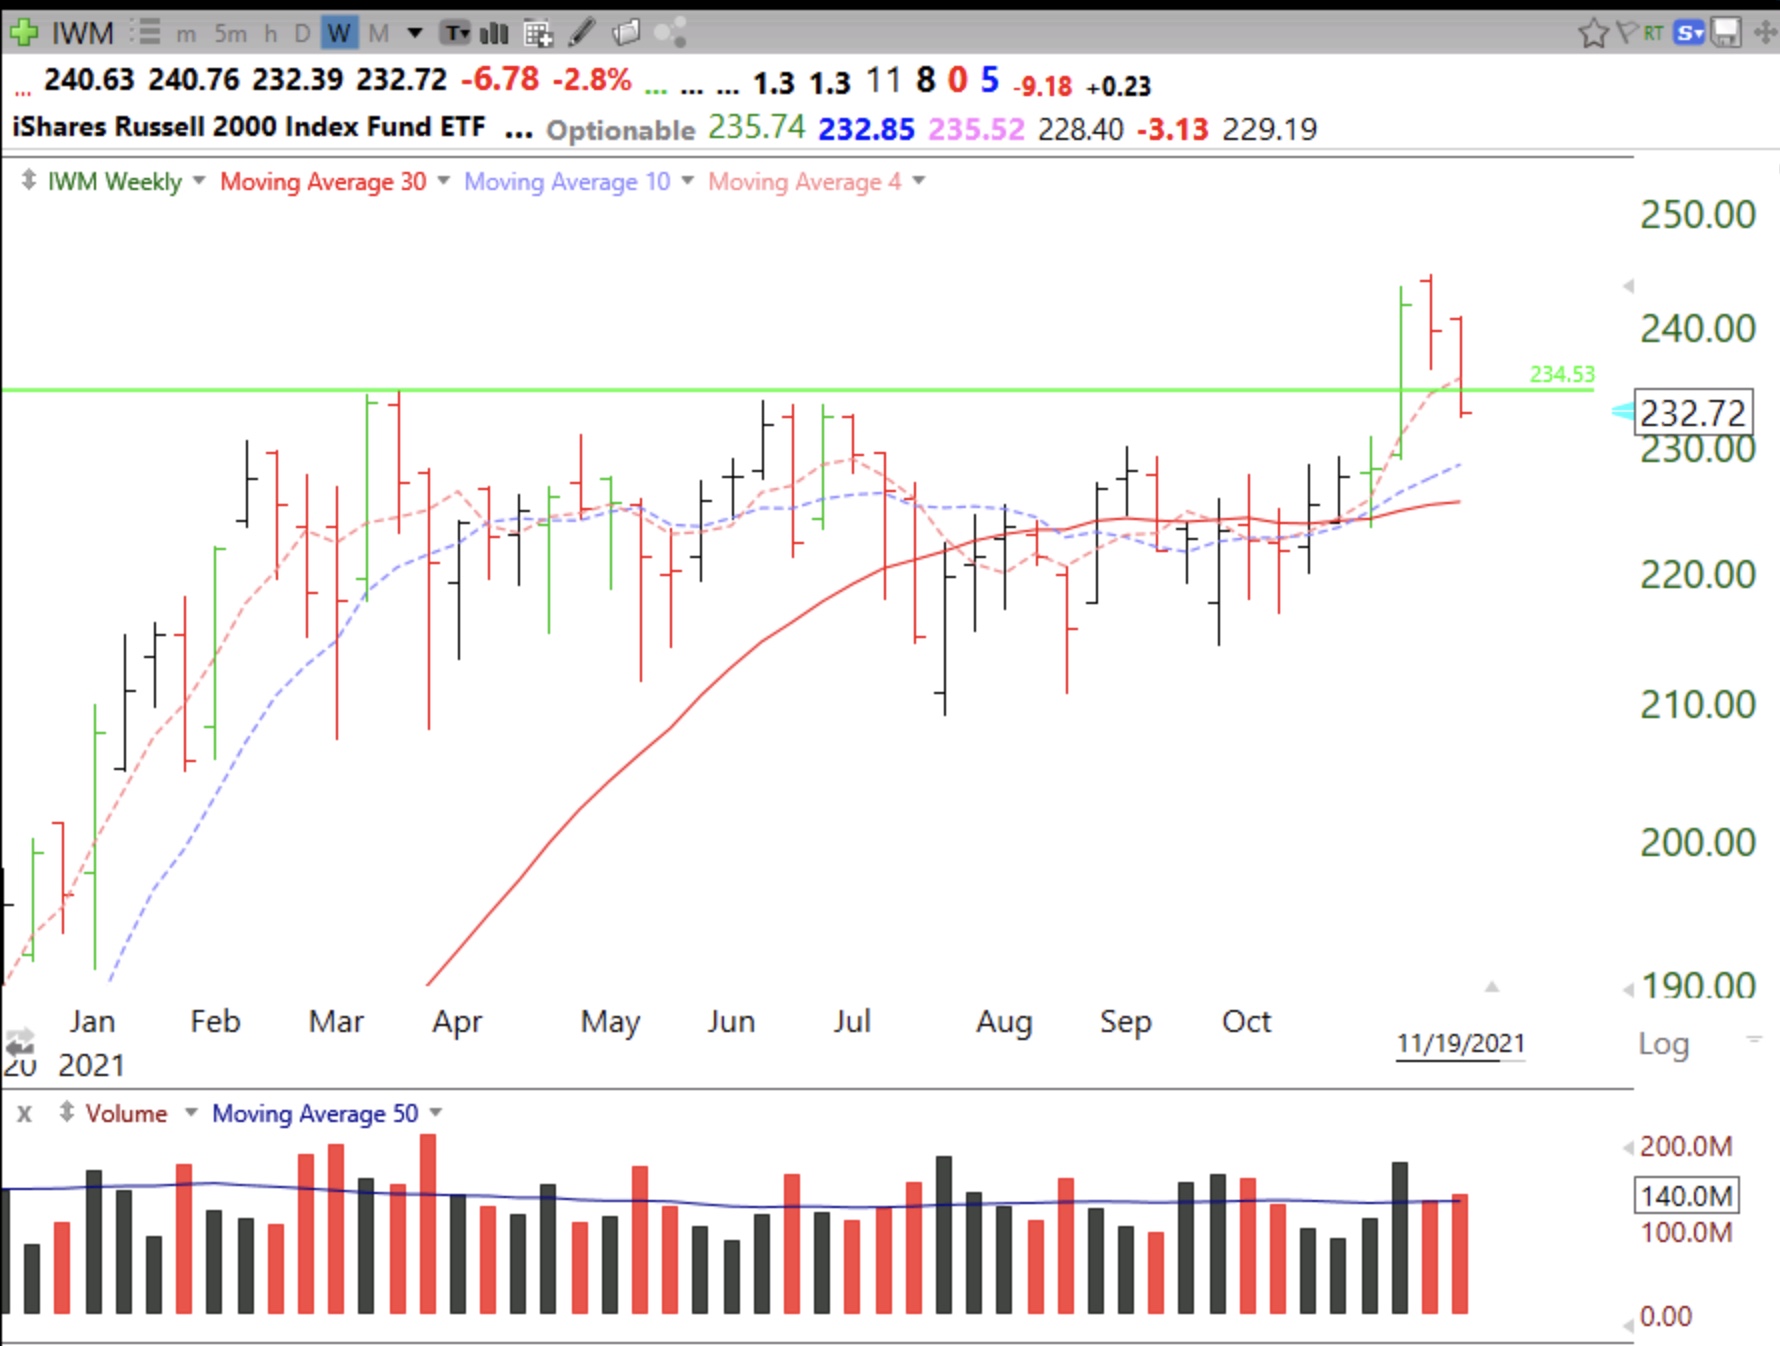
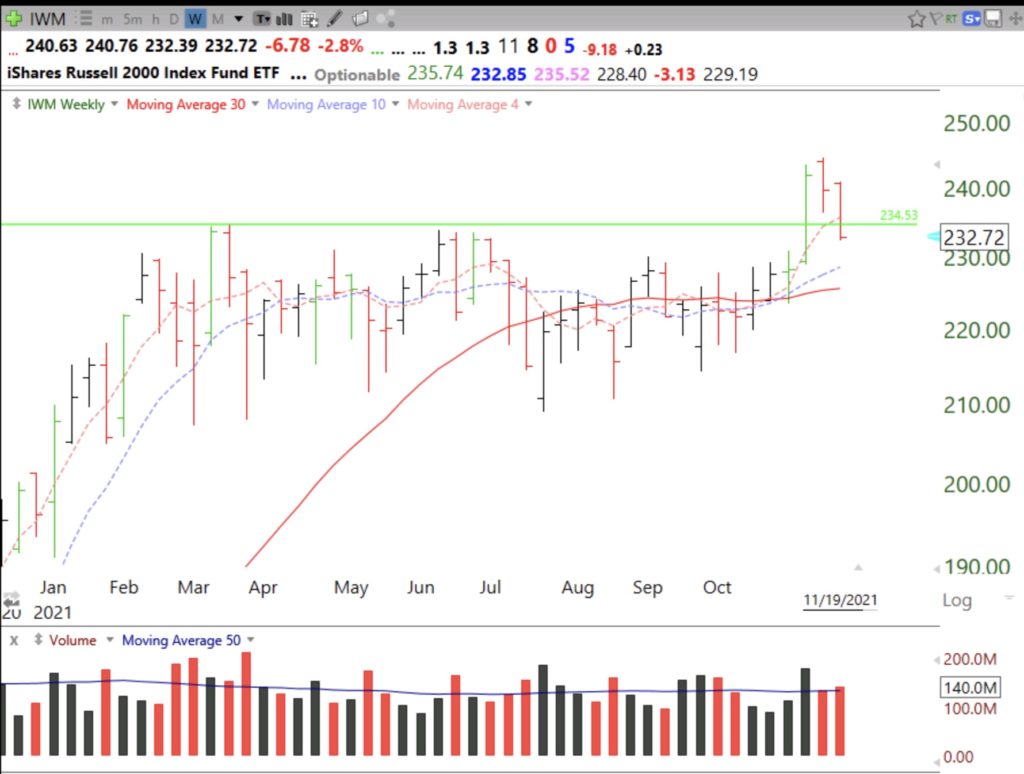
Why is it that while QQQ and SPY are hitting new highs, the T2108 indicator has declined to 49%. This means that only 49% of NYSE stocks closed above their 40 day simple moving averages. And the weekly chart below shows that the Russell 2000 small cap stock index ETF has now had a failed green line break-out (GLB), which had broken out on above average volume 3 weeks ago. Failed GLBs often lead to significant declines–this is very concerning to me.
Back in the 70’s there was talk of the nifty 50, a set of glamor stocks so strong that market pundits urged the public to buy them, lock them up and hold them forever. The 1974 bear market plunge annihilated these stocks and their buy and hold investors. Today there are so many people enamored with a few famous huge cap stocks, TSLA, AAPL, FB, GOOGL, AMZN etc. There is a whole new crop of traders who have never experienced a real 10+ month bear market. History does not repeat itself, but it sure does rhyme……
The GMI has declined to 5 (of 6) but remains Green. The GMI-2 has components primarily reflecting the QQQ and has not weakened much yet. Stay tuned to see if these indicators should weaken.