 Dr. Wish
Blog Post: Day 11 of $QQQ short term up-trend, it could end on Monday? $IBD 50 type growth stocks are in a BWR down-trend, see daily modified Guppy charts of $FFTY and $QQQ. Some thoughts on what this all might signify. The dollar is falling while long rates are rising! See charts.
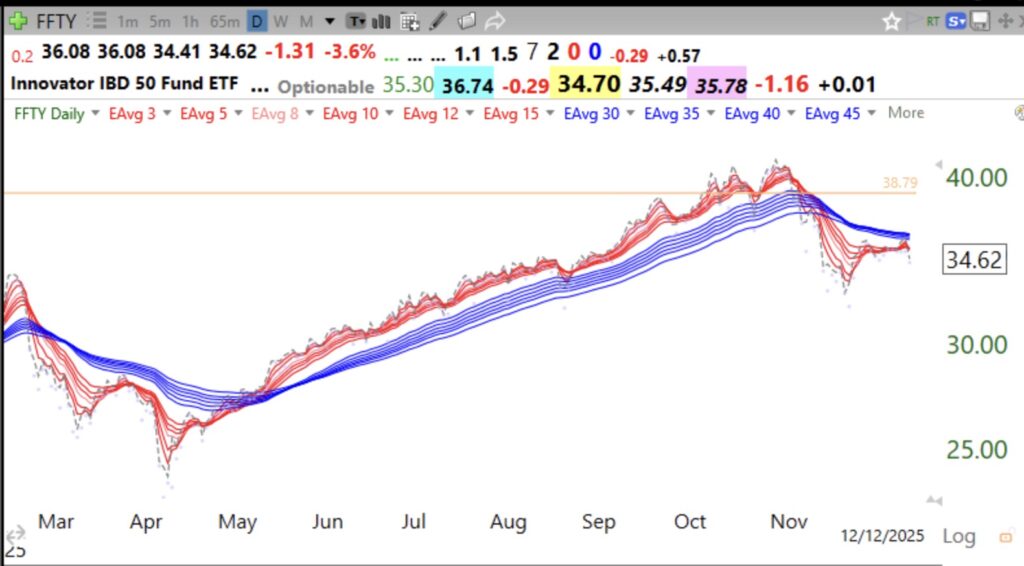
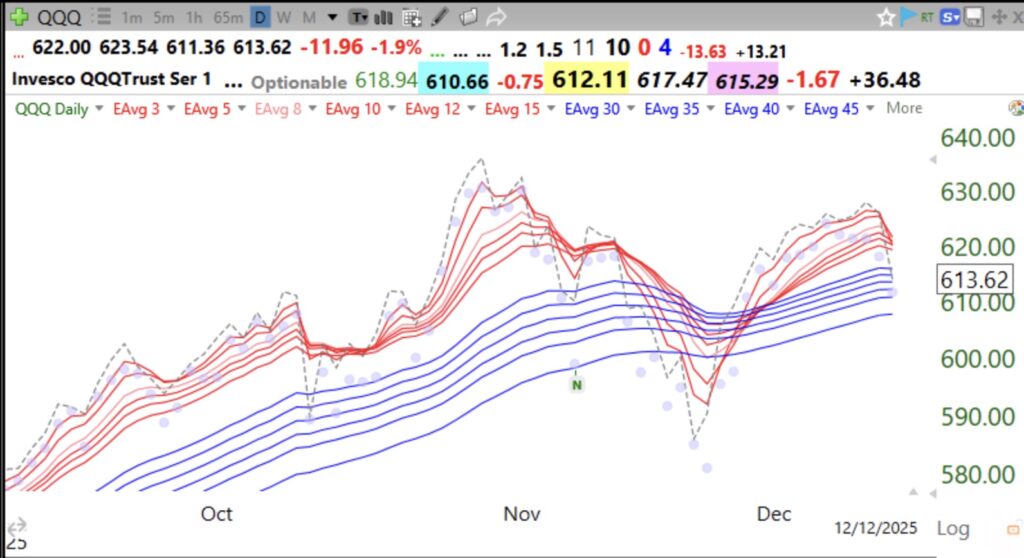
During last April’s market decline, the ETF FFTY, based on the IBD50 index, entered a daily BWR decline.This means that the shorter term averages (red lines) were declining below the longer term averages (blue lines) such that there was a white space separating them, hence a BWR down-trend. FFTY subsequently entered a RWB up-trend that ended in November. FFTY continues to be in a BWR decline, perhaps signifying that many growth stocks are weakening. The component in my GMI table below that is positive if the IBD Growth Mutual Fund index (0MUTI) has closed above its 50 day average is now negative. I am therefore becoming bearish on the growth stocks in the Nasdaq 100 ETF (QQQ). My short term QQQ up-trend is in its 11th day but may end and turn down on Monday. I am therefore mainly in cash in my trading accounts. I am a chicken. However, QQQ, is now very oversold (stoc10.1=13), a level where QQQ has bounced before. I must be defensive AND nimble. This chart shows that QQQ remains in a daily RWB up-trend, but it could be faltering. QQQ closed (dotted line) below all of the red lines and has entered the blue lines. This week should tell us whether the RWB up-trend is ending. Will a Santa Claus rally rescue the up-trend?
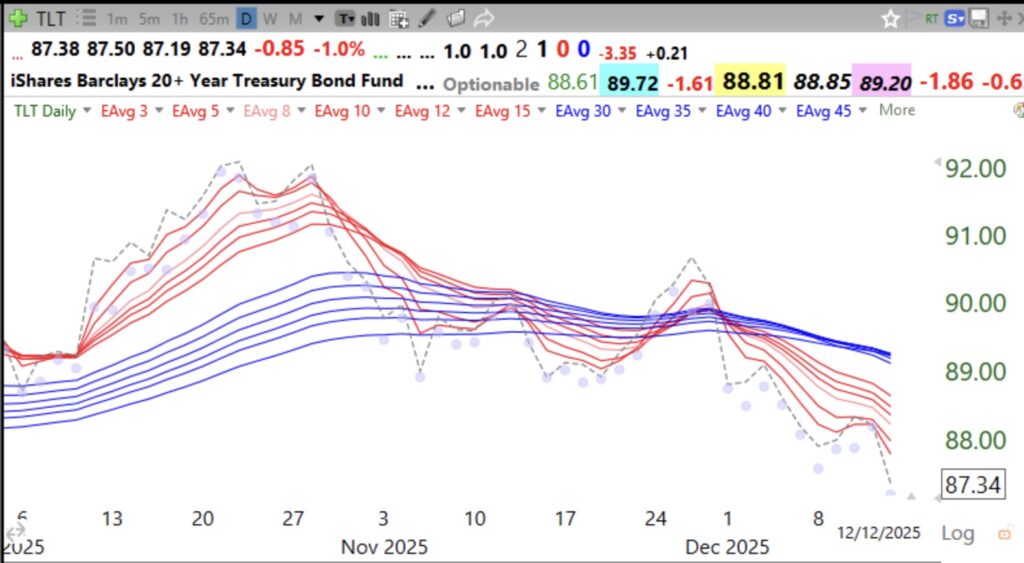
One other worry, long bonds (TLT) and the dollar are both declining. Look at this daily Guppy chart of UUP and TLT.
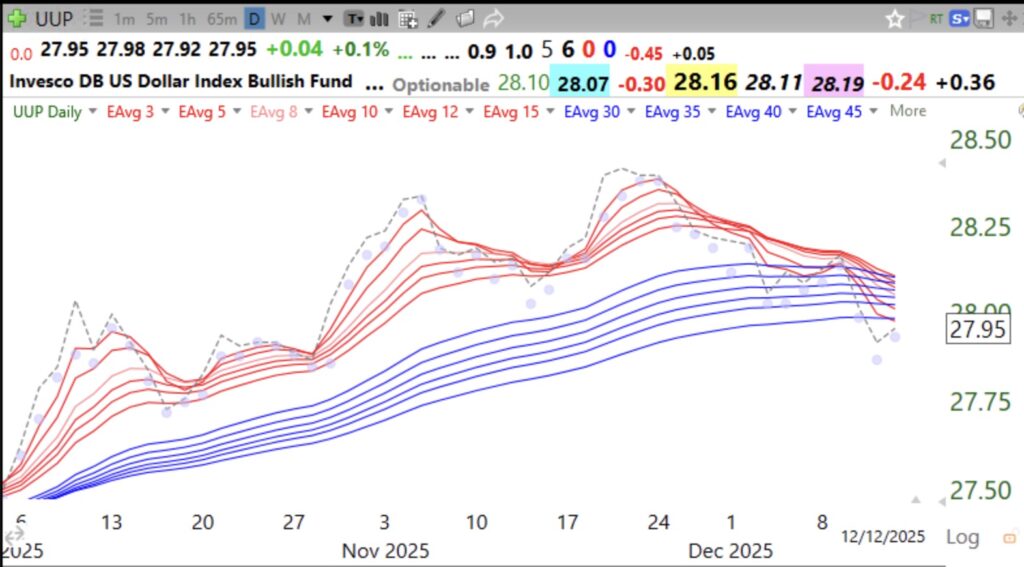
When bonds fall, interest rates rise and the dollar should rise. But it is not!!!!! Maybe this is why GLD is rising?
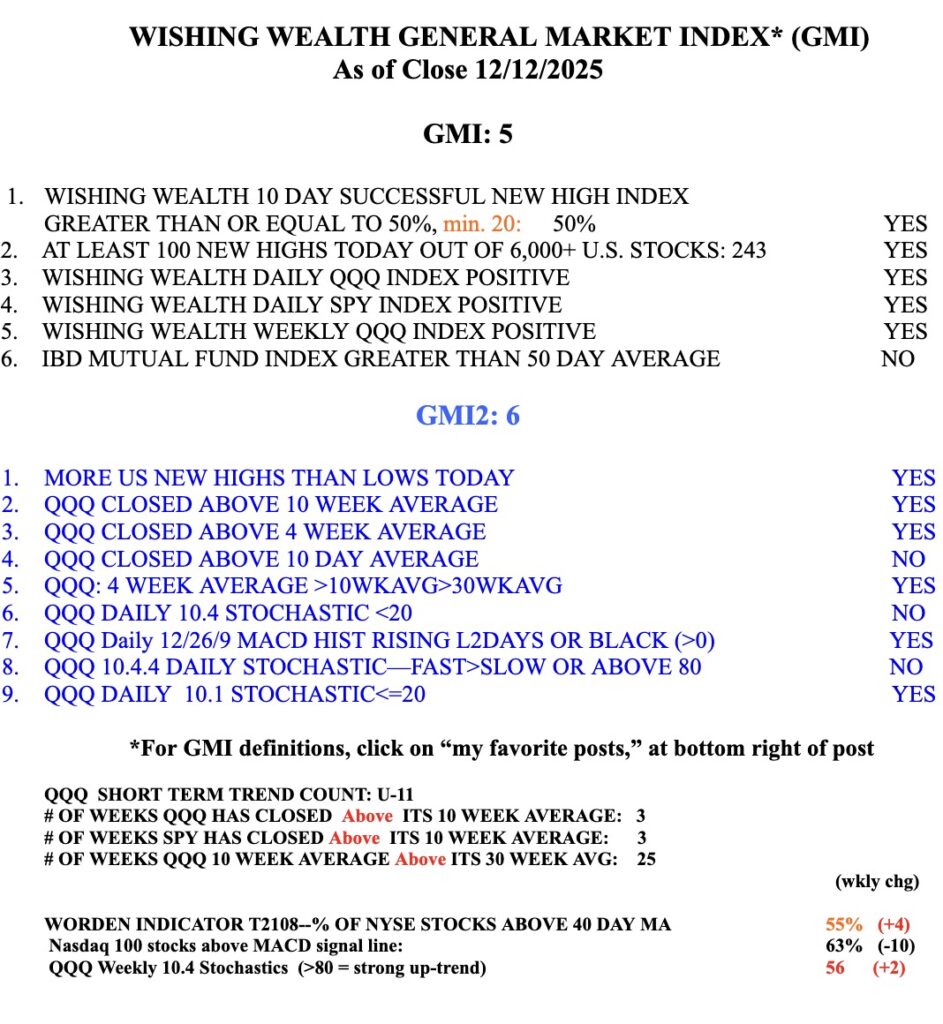
The GMI=5 and remains on a Green signal. Note that Component 6 of the GMI is negative. If the growth mutual funds are faltering, I have found I am unlikely to profit by being long growth stocks. It is also concerning to me that the recent rally stalled below QQQ’s October high. Will November’s lows hold? I made much $$$ in the 90s by buying IBD100 stocks, the predecessor of the IBD50 collection.
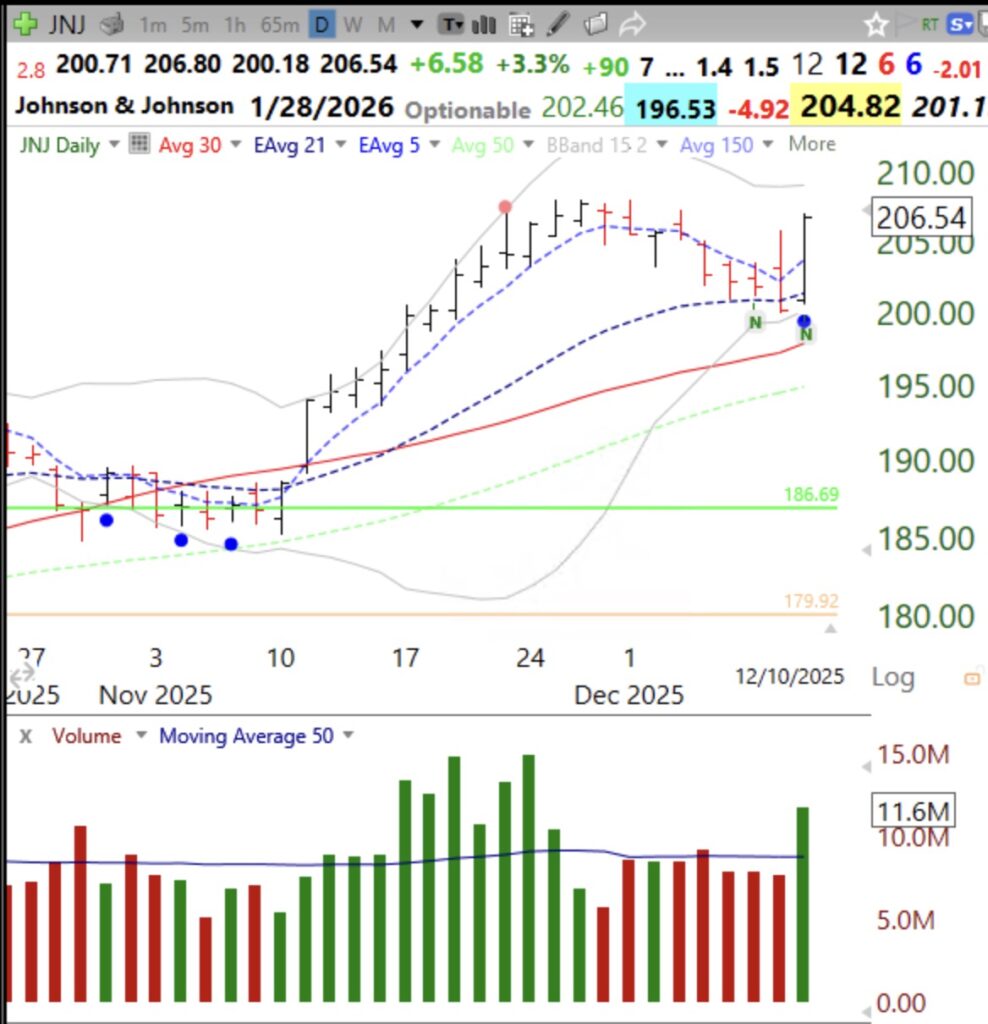
Blog Post: Day 9 of $QQQ short term up-trend; $JNJ had a Blue Dot of Happiness setup early Wednesday, I tweeted about it on X in the morning; see daily chart.
I was on the road and took a chance to post about JNJ early in the day. Sometimes blue dots occur in he morning but the stock fails the setup by closing. JNJ was a successful break out, see daily chart below. Note the high volume on this bounce from oversold. My Blue Dot of Happiness setup is explained during my TraderLion presentation on Day 6. I look for a stock that recently traded at an ATH and then bounced from oversold. I like this setup because I know if the bounce fails I can exit immediately with a small loss. This bounce looked especially promising because JNJ was also just above its lower 15.2 daily BB, another area of support. JNJ is up 50% from its lowest price in the past year and above its last green line top. Follow me on X, @WishingWealth, to get intraday tweets on promising stocks.