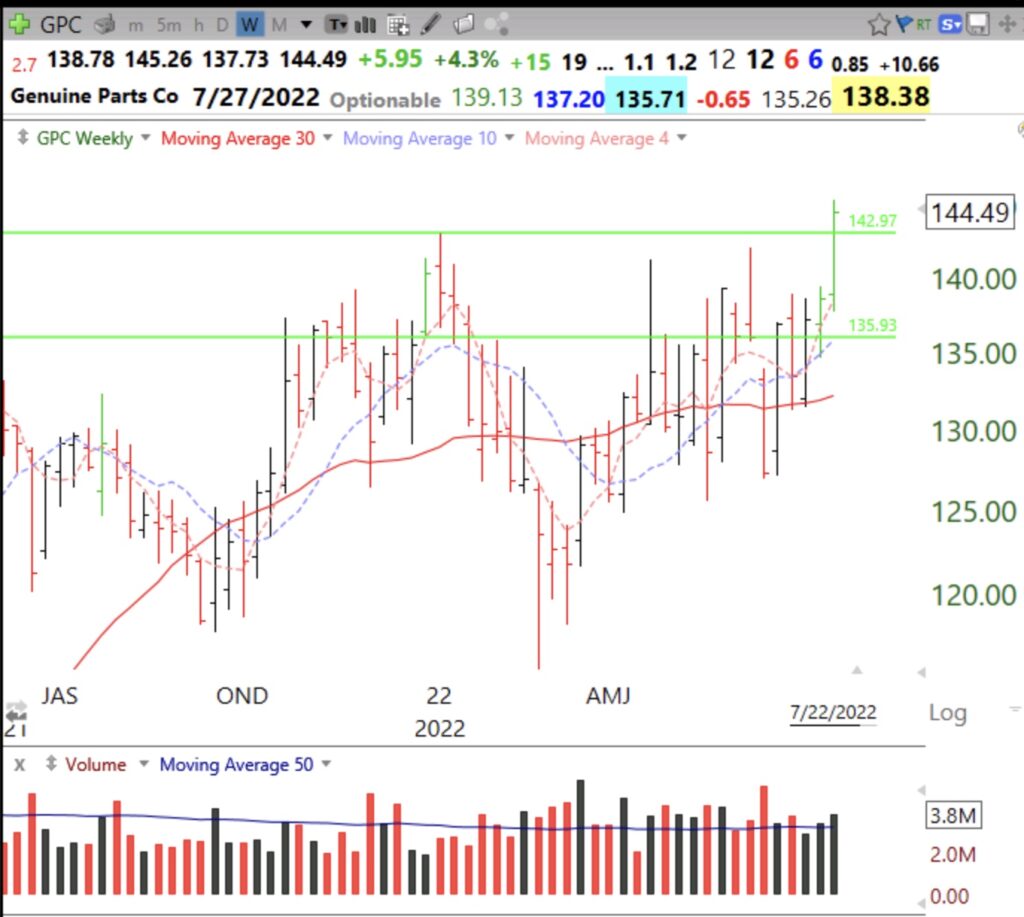
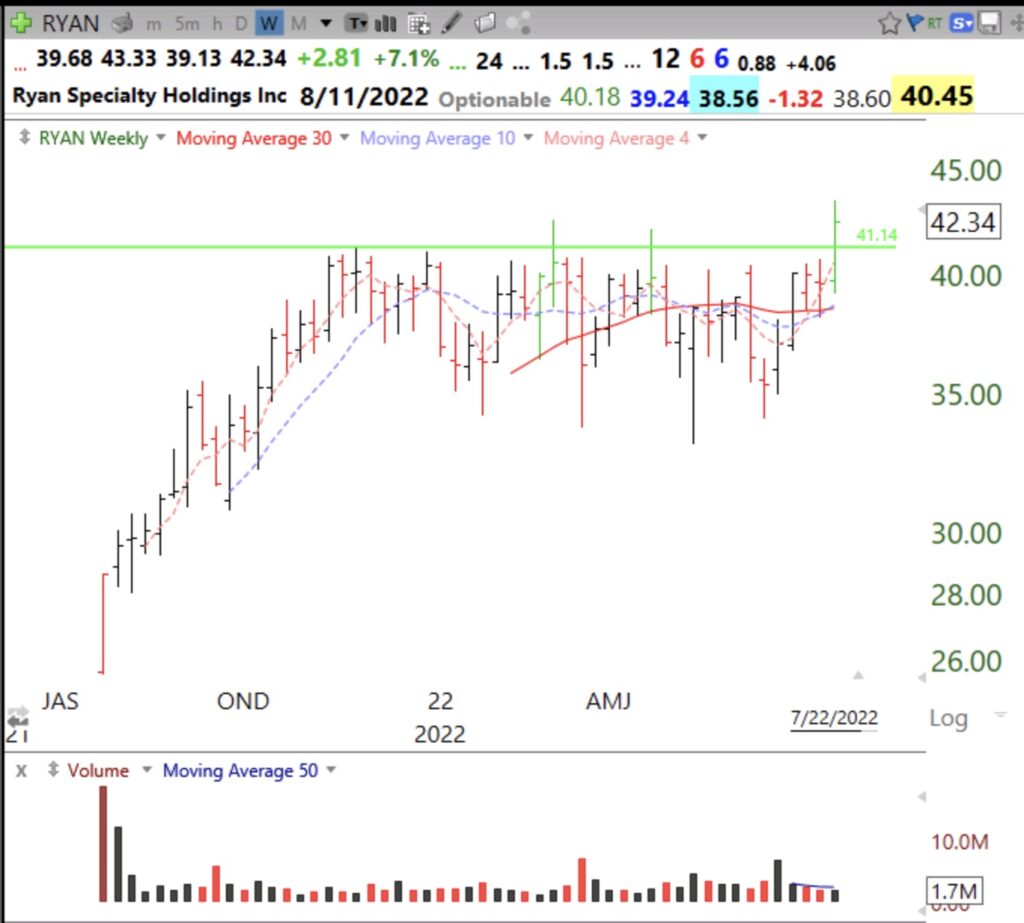
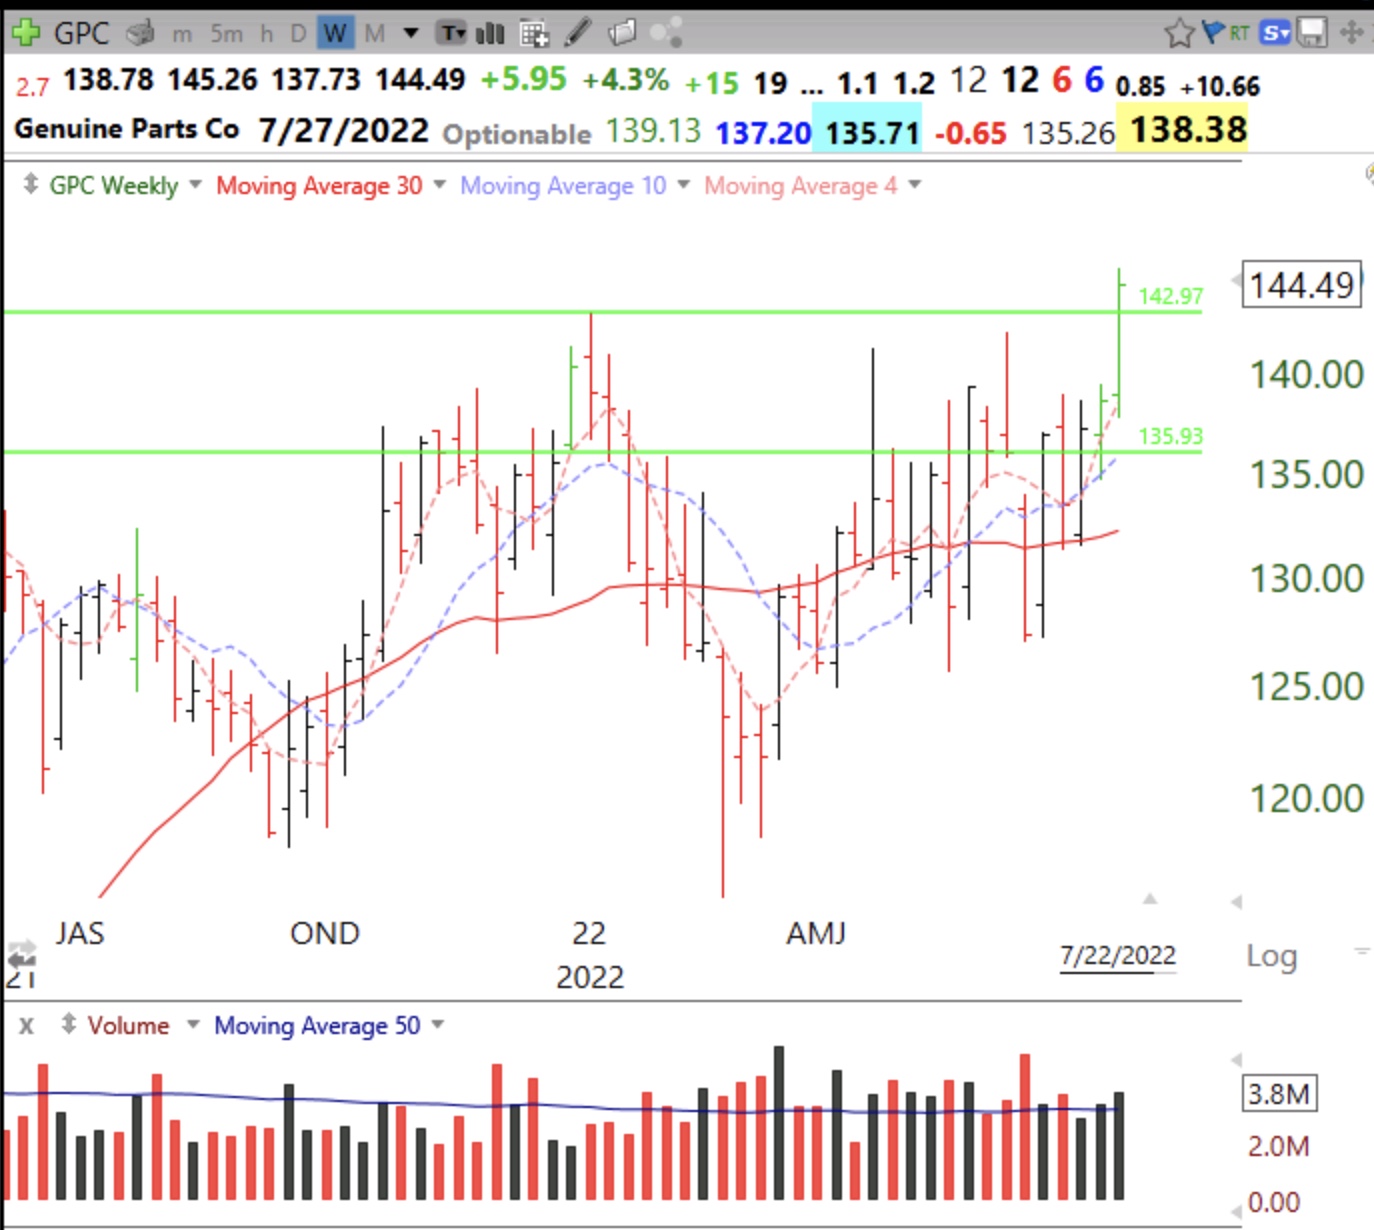
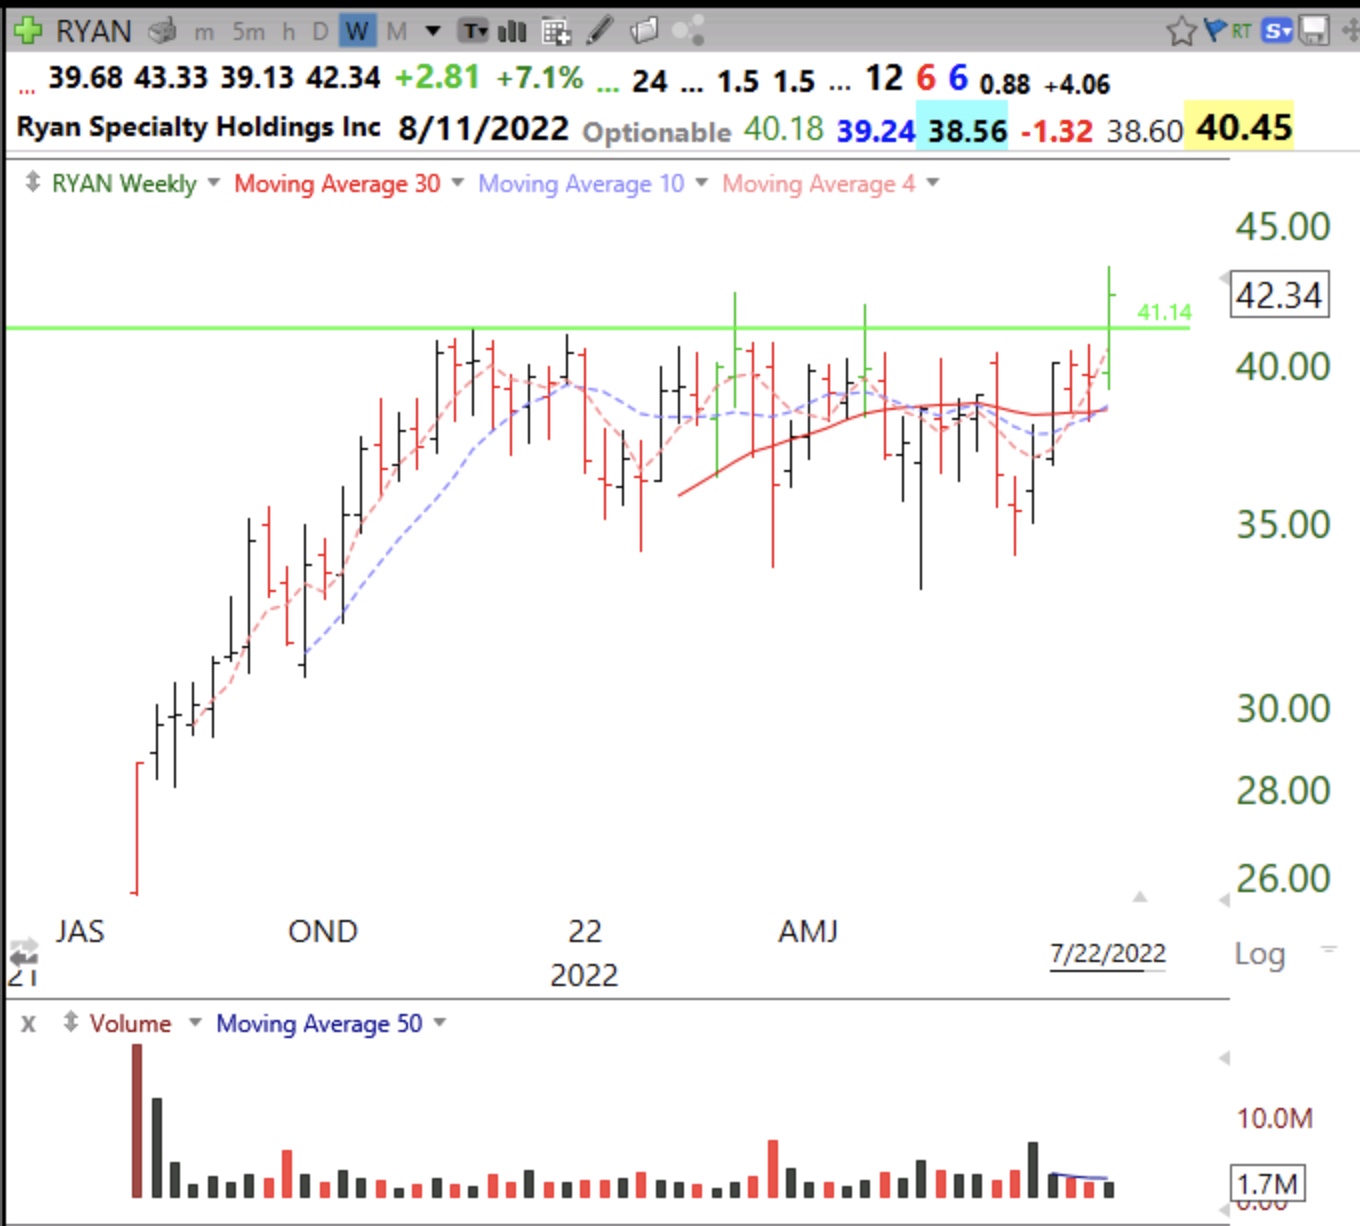
I ran a scan of stocks near their ATH that had hourly, daily and weekly RWB patterns. Seven of 7,421 stocks came up. Two of them had GLBs last week, GPC and RYAN. GPC has the better fundamentals on MarketSmith and broke out on above average volume. RYAN is a recent IPO and trading volume last week was below average. Be very careful buying GLBs during this market down-trend. Many fail. When only 7/7421 of US and foreign ADRs were this strong technically, it tells me how weak individual stocks are. This description of RWB patterns, which I have edited to include hourly time frames, can be found in this blog’s glossary tab.
RWB (red white and blue) pattern
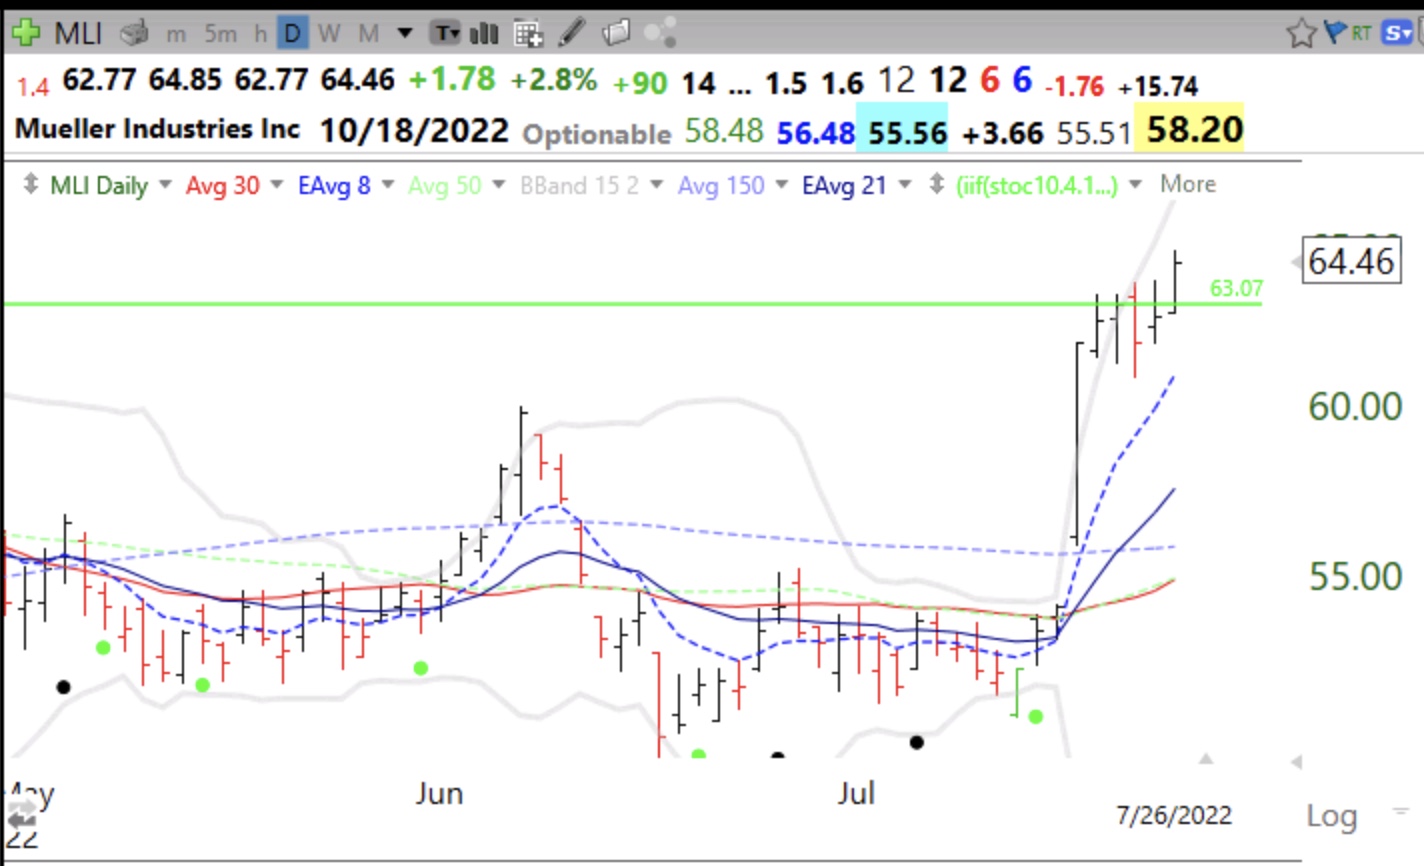
This is the term I use for plots that produce a pattern with 6 red shorter term exponential weekly (or daily or hourly) averages rising above 6 longer term weekly (or daily or hourly) exponential averages such that there remains a white space between the two sets of averages. This assumes a chart with a white background. The 6 shorter term exponential averages are 3,5,8,10,12,15 weeks and the longer term exponential averages are 30,35,40, 45,50,60 weeks. I also add a 13th dotted line (a moving average of 1 period) that shows the close each week (or day or hour). A strong rocket pattern has all averages lined up with each average rising above the next longer average and the closes above all 12 averages leading them higher. My charts are an adaptation of Daryl Guppy’s GMMA charts. His book is listed at the bottom of this blog page. Richard Moglen has produced a free video showing how to set this chart up.

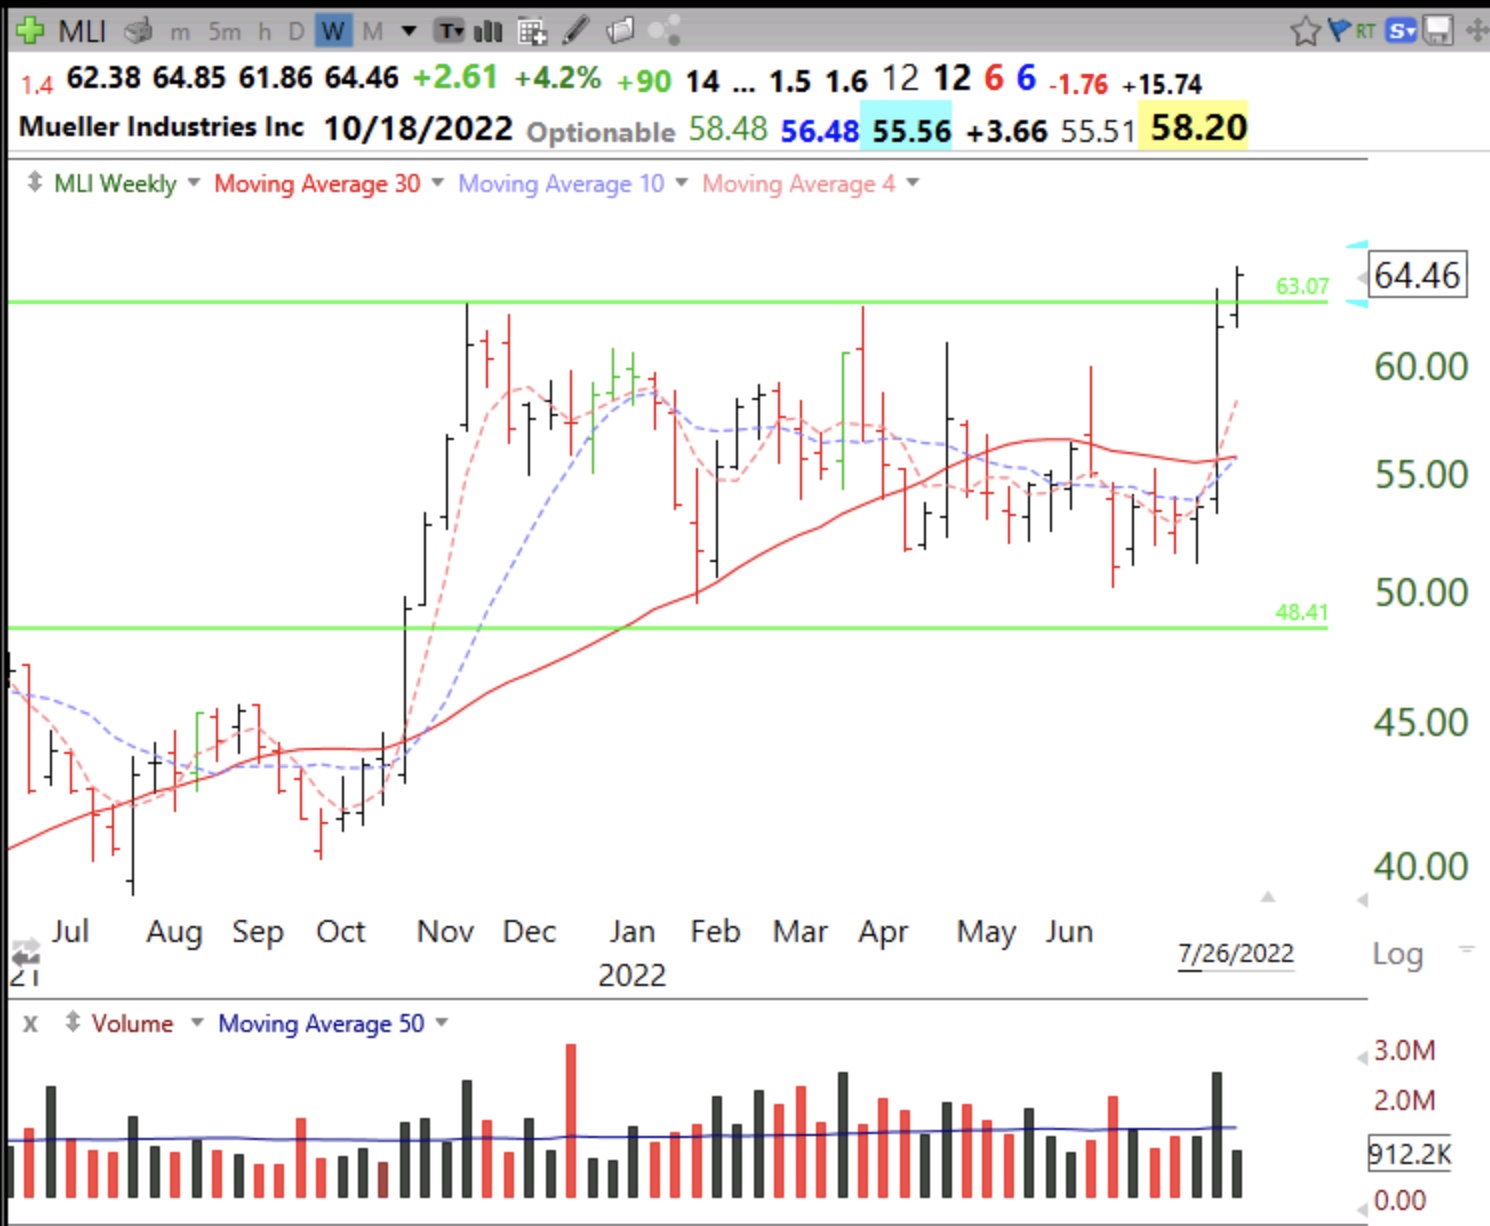
Below are weekly charts.