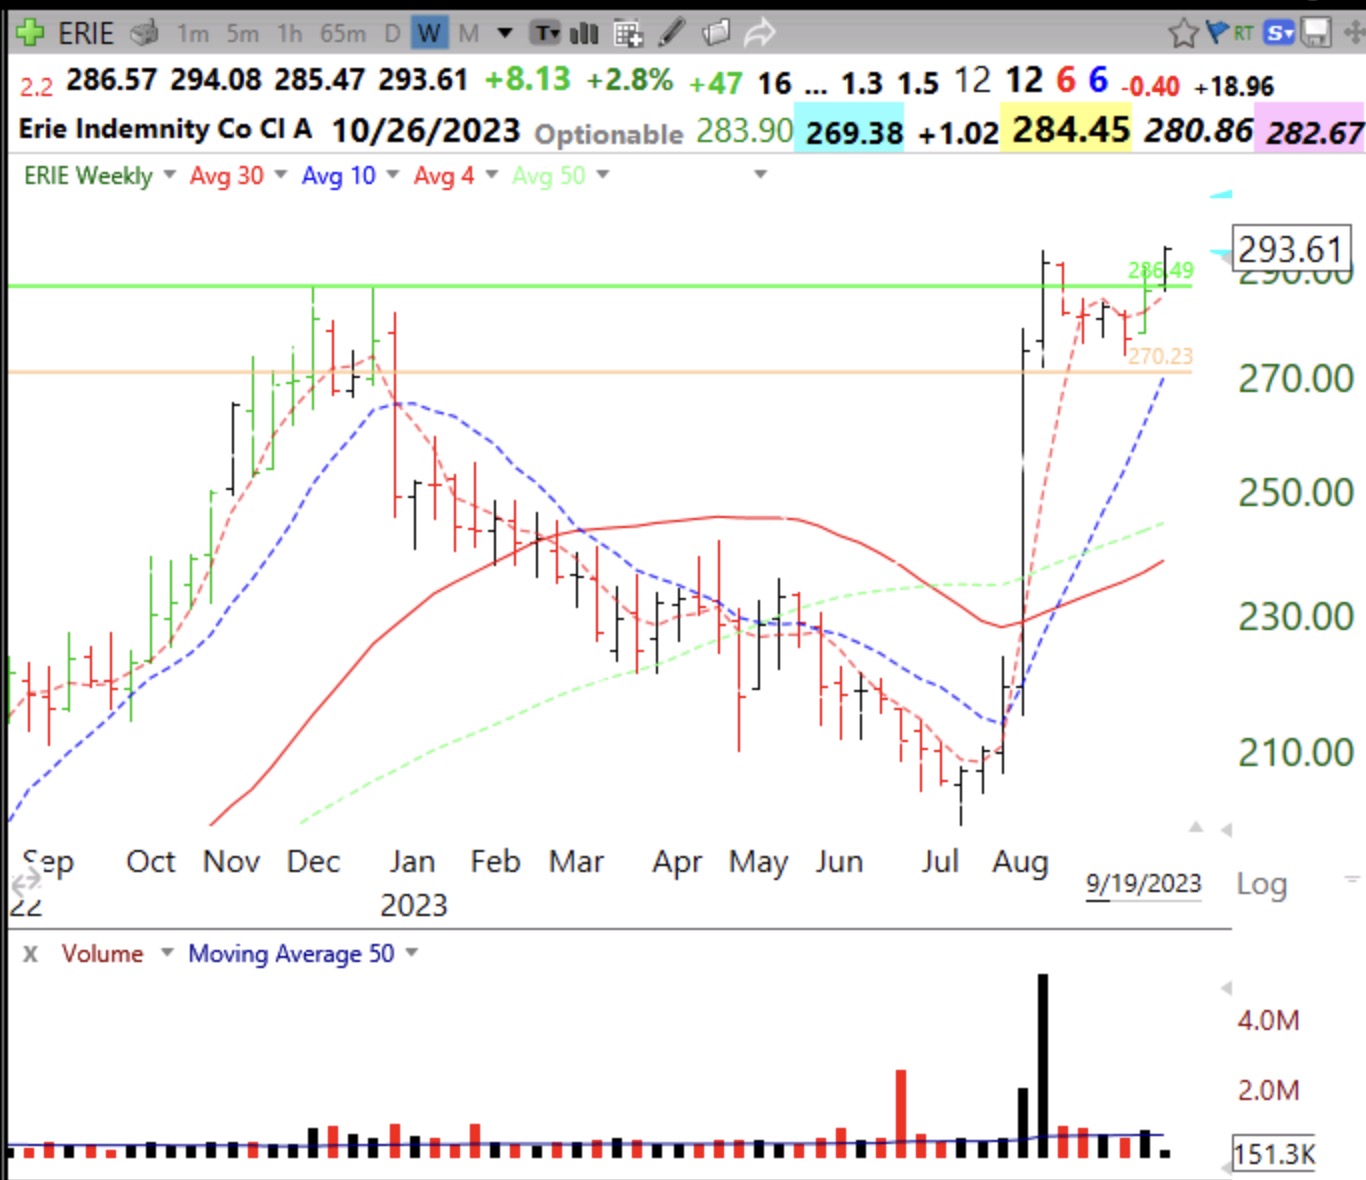
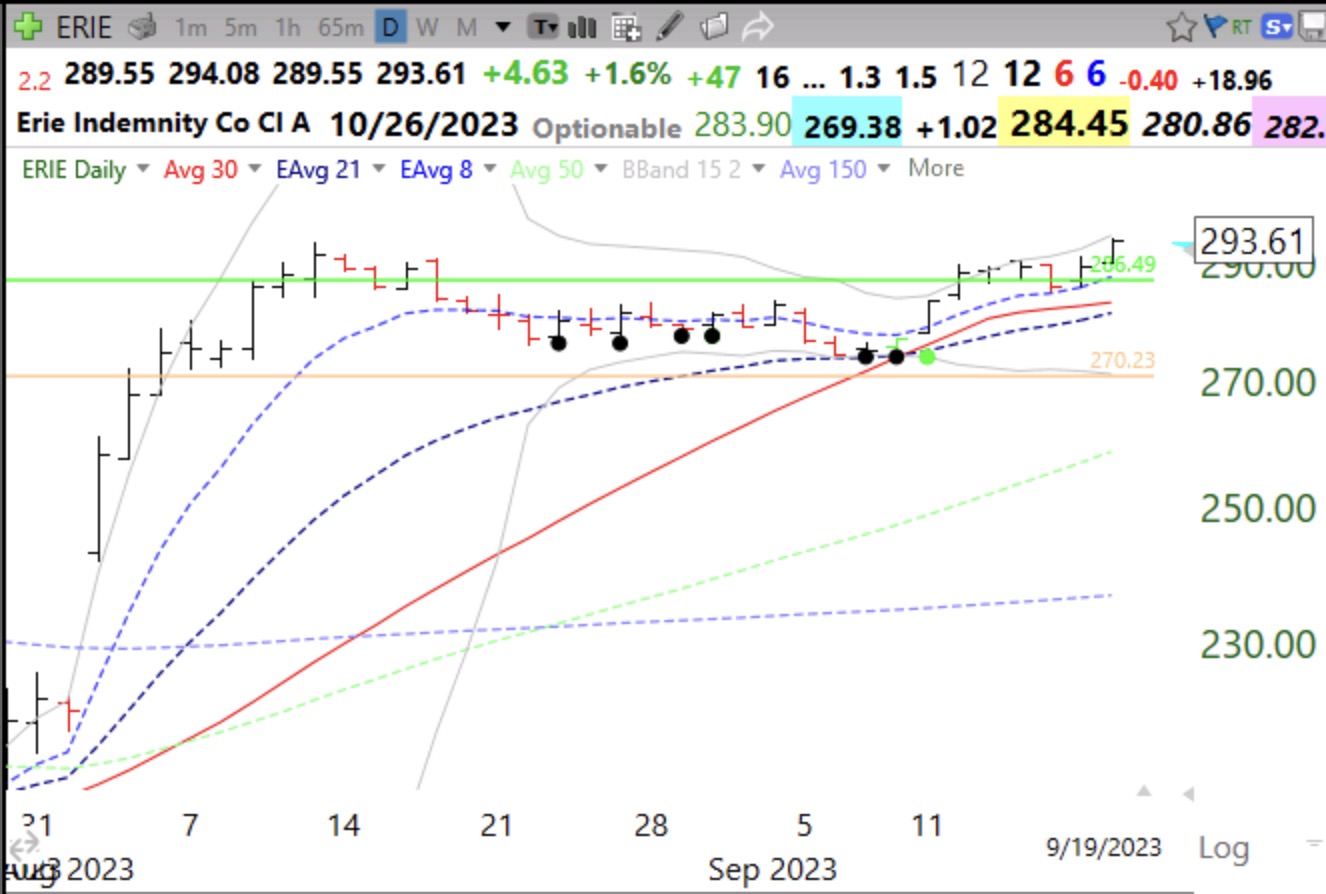
This weekly 10:30 chart of SPY shows the trend of the market. Until the 10 week average rises above the 30 week average, the down-trend persists. Look at the pattern in 2021. Note the close (gray line) below both averages leading them down.
Dr. Wish
Blog Post; 35 US new highs and 438 new lows; $INSW is one of 4 stocks at ATH, see daily chart of $INSW and how I evaluated it
I am writing this post to show my students a way to evaluate a company that comes to one’s attention because of strong technical action. TC2000 showed me that INSW is one of four stocks that hit an ATH on Monday and that it came public in 2016. INSW had a GLB with above average volume on 9/6, closed below its green line the next day and retook it on 9/8. It advanced to a new ATH on Monday with the highest daily volume since last April. Note how INSW has found repeated support at the 8 day exp average (blue dotted line), which has been climbing above the 21 day exp avg. since mid-July. Its price has doubled from a year ago, a nice sign of technical strength.
MarketSmith shows the company to have a composite rating=98, Acc/Dis=A+ and group RS=98. While it has not made a profit yet, sales were up triple digit the last two quarters, fund ownership is climbing and expected earnings per share this year are $5.03. This shipping company is becoming profitable with a projected P/E ratio around 7. If I made a pilot buy today I would place my sell stop below today’s or yesterday’s low. Any stock that can come through this market at an ATH is showing incredible relative strength.
Note the weekly RWB up-trend.
The weekly chart shows INSW is in a Stage 2 up-trend and closely following the rising 4 wk avg (pink dotted line). It has closed the last 11 weeks above this average–a sign of a rocket stock, as long as the 4wk>10wk>30wk averages.
Blog Post: Day: Day 14 of $QQQ short term down-trend; Where is $QQQ likely to bottom? See how technical analysis could have helped you to avoid the $FDX debacle
Will QQQ stop at the June low or will it decline to the trend channel line (237.47) and former green line top or go further below? Note the above average volume last week when QQQ declined.
FDX gapped down Friday after the company announced they were withdrawing guidance and feared the whole world was entering a slow down. Anyone who understood basic stage analysis would have exited FDX in August 2021 when it closed below its 30 week average (red solid line) and entered a Stage 4 down-trend. As long as the 30 week average is declining, I am out of a position or short.
FDX was also recently in a weekly BWR down-trend.