Taking Stock of the Market

“MY ONLY SOUND REASON FOR BUYING A STOCK IS THAT IT IS RISING IN PRICE .   IF THAT IS HAPPENING, NO OTHER REASON IS REQUIRED.   IF THAT IS NOT HAPPENING NO OTHER REASON IS WORTH CONSIDERING.”

Nicolas Darvas, Wall Street: The Other Las Vegas, New York: Kensington Publishing,1964, reprinted 2002, p. 134.

Actually, Darvas (who made 2 million dollars in the market while traveling around the world,   during 18 months in the late 1950’s)   also liked to buy companies in visionary industries and with good earnings or the promise thereof.   Do you know that the American Stock Exchange suspended stop orders after his best selling book was published.   For many years I could only use stops on the NYSE.   Now, with computerized trading, I can use stops on all stocks.   The book quoted above was blackballed by the financial press (no one would advertise the book, especially Barron’s, even though his book helped boost Barron’s circulation) because in the book, Darvas had the nerve to compare the structure and functions of the NYSE to those of a casino.   Imagine suggesting that trading   stocks had something to do with gambling! Things are different today, of course.

In yesterday’s post, I told you how I focus on finding stocks that behave like rockets in the same way that Darvas did.   The strategy of buying strong stocks at new highs in a bull market is also advocated by great traders like Livermore, Loeb and O’neil.   While I recommend reading the masters directly, John Boik’s new book, Lessons From the Greatest Traders of All Time. provides a good overview of these persons’ trading philosophies.

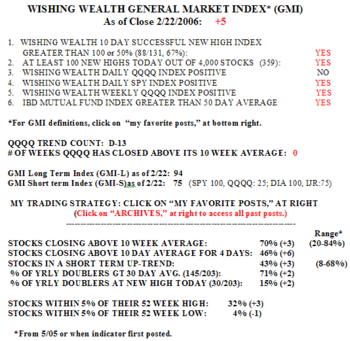
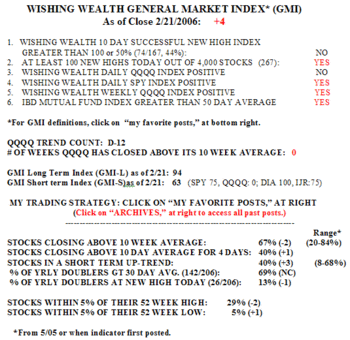
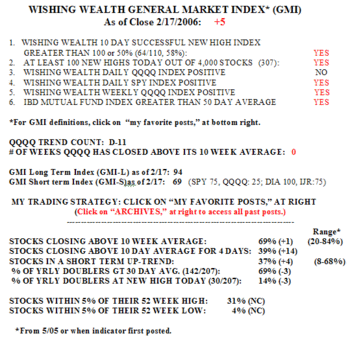
Friday’s bounce did not come close to changing my General Market Index (WW-GMI.)   As the table below shows, the index is still stuck on zero. Only 54 stocks out of my universe of 4,000 hit new highs on Friday.   Ten days ago, 22 stocks hit new highs and only 12 of them closed higher Friday than they did on the day they made the new high.   In comparison, 229 stocks   hit a new low 10 days ago and 135 of them closed lower on Friday than they did on the day they hit the new low.   The bottom line is that there were 11 times (135/12) as many “successful” new lows than “successful” new highs in this market.   Moreover, in the last ten days we had somewhat better odds of profiting from shorting new lows (135/229=59% ) than by buying new highs (12/22=55%).   Are you still betting on stocks to rise?   The IBD growth mutual fund index is below its 50 day average and its 200 day average.   So growth stocks are not doing well.

The situation is even worse than this index indicates.   Since January 3, the NASDAQ 100 (QQQQ) has fallen 11.4%.   Of the 100 stocks in this index, only 20 stocks have risen.   The median decline was 12.9%, meaning that one half of the declining stocks in the index fell more than 12.9%.   Twenty of the stocks fell 19% or more in this period.   If you bought any of the NASDAQ 100 stocks at the beginning of January you had an 80% chance of a losing trade.

Maybe you did not have enough foresight or knowledge to detect the beginning of the decline in January.   What if you waited until March 11 , when the decline resumed, after a brief pause.   Between March 11 and last Friday, the NASDAQ 100 index lost 5.9%.   During that period, 75/100 stocks or 75% declined, with a median decline of 9.2%.   By getting out of these stocks in mid-March you would still have avoided sizable losses.   My point is that even if you miss the exact change in the trend, it still helps to get in synch with the trend.   Most people, when they have a loss, hope that things will get better, and when they are nursing a profit, fear losing it.    Reverse the emotions.   Hope when you have a profit and fear when you have a loss.   In a downtrend, go to cash or short, and swim with the tide.

Why is everyone addicted to being bullish?   Why do we only want to buy stocks?   Why does the media run from shorting?   We can have the media pundits recommending the purchase of stocks in 2000-02 as they declined   from triple digits to single digits.   But advising people to short stocks is too risky for them?   Traders profit from price trends, and stocks move up and down.   It is time to educate ourselves about profiting from market declines or to at least run from the market during times like these.   Are you convinced yet?

THE BOTTOM LINE IS THAT WE MUST TIME THE MARKET AND WE MUST GO WITH THE MARKET TREND IF WE WANT TO PROFIT IN THE STOCK MARKET.

A lot of industry groups have been declining.   I have been saying for weeks how sick the housing stocks look.   I noticed this weekend, however, another industry that looks sick–education.   Check out APOL, CECO, COCO.   I am not recommending that you short them; just take a look at their weekly charts and see if you detect the danger signs.

I guess everyone will be watching the Fed action this week.   The Fed is in a bind.   If they raise rates, it means they are still sensing a risk of inflation.    If they do not raise rates, the pundits will opine that the Fed must see a weak economy on the horizon.   Perhaps the best outcome would be for them to raise rates and say they are almost through.   It probably won’t matter, however, the die may already be cast with regard to the economy.   Give me a word that begins with “R.”

My Trading Strategy, Part II

IT TAKES A ROCKET SCIENTIST!

(Copyright ©   2005, by Eric D. Wish.   All rights reserved.)

“There is no magic about buy signals. They are only devices by which we call our attention to stocks that have already begun to attract the attention of others.”

Burton Crane, The Sophisticated Investor, 1964, p. 49

Can you believe this?   The day after I tell you how much I admire Jim Rogers, he goes on television and tells everyone that   he   buys stocks that are near their lows and avoids those hitting new highs.   I guess I better set the record straight by telling you where I stand on this issue.   Assume you are looking over a field of rockets, all on their launching pads.   Your job is to determine which rocket will take you to the moon.    There are a number of ways to approach this problem.   One person might study all they could about the model of the rocket and its history.   They might find what similar rockets have done in the past and that a rocket with a particular size and payload should be able to go quite far.   This strategy is equivalent to the approach taken by the fundamental analyst.   He (or she) knows the company’s prior earnings and projections for the future.   He can tell you all the reasons why a particular company’s stock should do well–earnings, cash flow, sales, industry trends etc.   He can estimate the stocks “true” value.    

Read more

Bear Market?

“Jim Rogers: Bob, there’s no question we’ve had a big pounding in the market in the last two weeks. So we may be due for a rally. But the market is going to be down this year and it’s going to be worse next year. We had huge amounts of money spent in 2003 and 2004 by the government to win an election. Now we have to pay the price. It’s not the end of the world. It’s just a bear market.”   THE COST OF FREEDOM RECAP, SATURDAY, April 23.

I like to watch Jim Rogers every Saturday morning.   In 2000, at the height of the tech market mania, Damon Vickers was the only radio commentator I heard who had the courage to tell (really scream) people to run for the exits.    Today, Jim Rogers is equally explicit (but calm) about his concerns for the state of the economy and for the U.S. stock markets.   And Jim is no neophyte.   He made his fortune in his 30’s trading along side George Soros.   When Jim speaks, I listen.

As long as I am talking about the   Fox Cost of Freedom Saturday morning telecast, I must mention The Chartman, Gary B. Smith. Gary was a presenter at my university’s investors speakers series a few years ago.   I missed his presentation, but heard about his accolades for the TC2000 technical analysis program that he was using.   It was on his recommendation that I subsequently switched to that program and became an enthusiastic user of TC2005.   (When I placed 5th in the Barron’s Stock Challenge a few months ago-in the professor category- I contacted Gary and we had lunch together.)   Gary is an avid chartist and writer who brings his considerable expertise in technical analysis to the Bulls & Bears program on Saturday mornings.

I received a question from a reader today asking me if I am somehow associated with   IBD or TC2005.   The answer is an unqualified no.   I am simply an enthusiastic and dedicated customer of both concerns. I can honestly say that I did not begin to make money in the market until I subscribed to IBD in the 80’s.   And, as I shall show in a subsequent post, the TC2005 program lets me do amazing scans of the market quickly and at low cost. (The program itself is free–how can one beat that?   I just pay about $25 each month for downloads of stock prices.)   How do you think I compute the WW General Market Index (WW-GMI)   and my other indicators each night?

Speaking of the WW-GMI, it is stuck at dead zero again.   Are you surprised?   Only 11 stocks that hit new highs 10 days ago closed higher today than 10 days ago.   That’s 11 out of 4,000!   Only 40/4,000 stocks even hit a 52 week high today.   Most telling, 99 stocks hit a 52 week low 10 days ago and are trading lower today than 10 days ago. So, the odds of having a successful short trade on a new low are 9 times higher than being successful going long on a new high!   The key to success in the market is trading with the odds in one’s favor.   At the very least, these statistics tell me not to buy any stock hitting a new high.   By the way, 208/4,000 stocks hit a new 52 week low today, five times the number that hit a new high.

I have been down on the housing stocks for sometime.   Today, 21/26 stocks in that sector declined.   Check out the trends in such stocks as MDC, MTH, BZH, CTX, MHO, WLT or DHM.   (I own puts on two housing stocks not shown here.)   Now, take a look at a chart of DIS, which fell 3.5% today on above average volume.   Do you think the weakness in housing stocks and a leisure stock like Disney is telegraphing something about the future economy?   Maybe this market smells the R word (recession).   It would not be the first time that the Fed tipped the economy into recession in its zeal to put a lid on inflation.   Remember, the Fed is an exclusive club of bankers, whose first priority is to protect all of their banks’ outstanding loans from the ravages of inflation.

I thought you might like to see a long term monthly chart of the NASDAQ Composite index. Click on this chart to enlarge.   It doesn’t take much chart knowledge to see the difference in the chart pattern since mid-2000.   Between 1993-2000 the index closed above its rising 30 month moving average (the red line). Then it began a sustained 3 year decline with the index below the average. After the bottom in 2002 there has been a relatively weak recovery.   Note the moving average is barely rising.    The time to make big money is when the indexes are rising smartly as they did in the 90’s.   You could have ridden that index up for years.   You could also have ridden it down for 3 years.   There is plenty of time to ride a real trend.   Right now we don’t   have a long term trend that is   worth riding–at least not in NASDAQ stocks.